Learn How People Use Your App – An App Analytics Tools Round-Up
Mobile App Growth
November 30, 2018

Knowing how many people download your app, how much money you’re making, or what users think of your app is important. But it’s definitely not the only thing you should be tracking. That’s where app analytics tools are vital.
It’s not all about the number of downloads. You also need to learn how, when, where and by what kind of audience your app is used.
Of course you can get a sense of that when you have people trying your app in front of you. But if you really want to know how well your app is doing, you need more data.
Believe it or not, your users are probably not using your app exactly like you think they are.
What to Track and Why
An interesting post from Dave McLure explains the key metrics startups should use. I tend to believe that a lot of things that are true for startups are true for mobile apps too.
For example, I think that app developers should copy more what entrepreneurs do for marketing before their launch. But I digress…here are the “Pirate” metrics Dave talks about:

You can measure some of the acquisition/revenue metrics using app downloads and revenue tracking tools, but if you use only that you will still be missing some important data.
By monitoring the right things, you’ll be able to learn a lot about your users and improve your app or your game.
A couple of other things before jumping to our thoughts on the different tools:
- Start monitoring things before you publish your app on the mobiles stores: even if you got only a few beta testers (try having as many as possible!), the data can still be used as an indicator
- Different tools for different apps: what might be a perfect tool for a kind of app might bring much less value for another
- Track what makes sense for your app and for your audience: not every app has the same objectives. And depending on which stage you are at, the KPIs that make more sense might change.
- Cohort analysis is really important
- Know where your app is going: do your best to pick a tool that you can still use (or afford) when you get more users, add platforms or countries
In-App Usage Analytics
Luckily, there are several tools for in-app analytics and some are free or have free versions. Some provide other features than in-app usage analytics (cross-promotion, ads etc.). This can be important to make your choice but it’s not the topic of this post so that part is not detailed.
All the solutions mentioned will require you to use a mobile analytics SDK as well as some level of customization.
A couple folks working at these mobile analytics companies have interesting things to say about their products and in-app usage analytics on Quora, you should check it out.
Disclaimer: the views expressed here are only ours, and some of the tools we couldn’t test extensively. We did our best not to make any mistakes when talking about these tools. But if we did, please let us know and we’ll happily correct them.
Flurry Analytics (Part of the Yahoo Mobile Developer Suite)
Price: Free
Platforms: iOS, Android, Windows Phone, Blackberry, Java ME
Flurry is a pretty complete tool for your mobile analytics. For each app, you can either use the “classic” dashboard or create up to 10 custom dashboards.
That compensates for the fact that to get some mobile app analytics, you sometimes need several clicks, which can get frustrating.

Here is the kind of info you can find or use in the dashboards:
- Usage: Active users, sessions, session lengths, frequency, retention, etc.
- Audience: Interest of users(your other apps + category), personas (type of your users – defined by Flurry), demographic
- Technical: Devices, carriers, firmware versions, errors
- Events: Define events, see user paths, create funnels
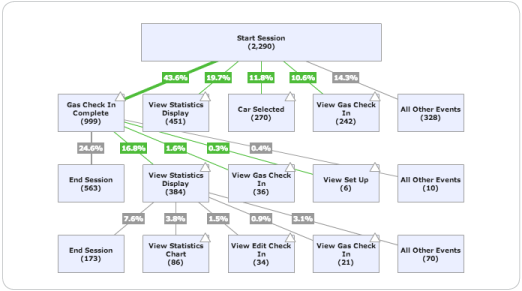
This is an example of how Flurry helps you visualize the path that the user takes when using an app. Seeing a visual representation like this can be a huge help in understanding where you can improve your app.
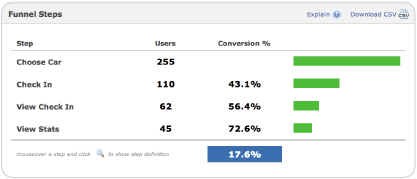
Flurry also provides easy to understand reports on conversion metrics.
Depending on the data/charts you’re looking at, you can filter via segments (age, first session, usage, country, etc), app versions and dates.
Probably because Flurry offers lots of other services (like ads), this tool is free yet provides a lot of analytics.
If you’re using Flurry, below is a video explaining how to create events and why:
We like: Thorough yet free, multiple dashboards, user paths and funnels.
Not so much: Lots of click required to get info, errors/crashes hard to identify and no cohort analysis.
Universal Analytics (Google)
Price: Free
Platform: iOS, Android
It might seem suprising, but Google didn’t launch a mobile app analytics tool before the end of June 2012. Mobile is huge, and they obviously want a key role in analytics. They have the advantage over their competitors that many people have been used to Google Analytics.
The Google Analytics for mobile apps SDK was first only available in beta, and is now part of Universal Analytics (out of beta since April 2014).
Universal Analytics is a pretty big deal if your product is cross-devices and requires sign in, because it is based on a User ID which allows for example to count 3 visits of one person across different devices as only 1 unique visitor:
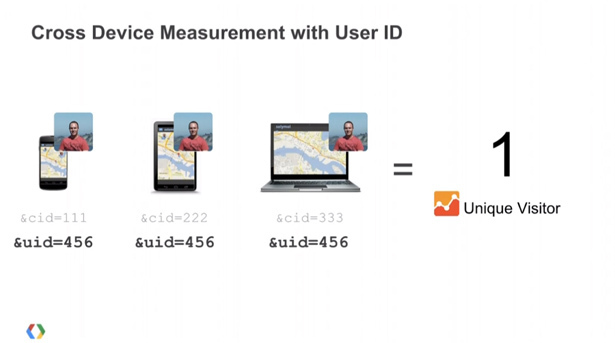
In the same way, if you track conversion and revenue in Universal Analytics, it will be cross device and will even let you know the path (which action was done on which device).
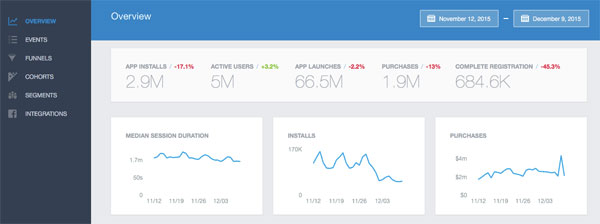
What if you just have a mobile app? Just like you would expect, Google Mobile App Analytics provides metrics to analyze your app performance.
Your app overview gives you reports organized in four categories:
- Acquisitions: find out about who your new users are. For Android apps on the Google Play Store, you can also track where your users are coming from and for example know how many sessions they’ve used or in-app revenue they’ve generated with Google Play Sources.
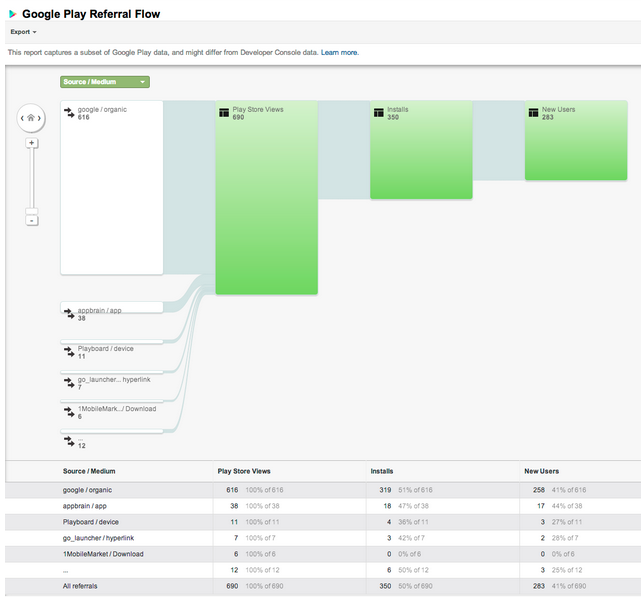
Know which source visitors come from, and how many installs and actual users you’re getting. More here. - Mobile App Audience / Users: just like for the web, you can know about new vs. returning users, their country/language, the app version, etc.
- Mobile App Behavior / Engagement: you can use event tracking like you do on your website, get reports on speed, crashes and exceptions.
- Mobile App Conversion: you can set up goal, track the conversion of your objectives and see the goal flow (Google’s equivalent to the funnel/user path).
Those mobile analytics (and Universal Analytics as a whole) are pretty complete, and Google is probably going to roll out new features as well.
We like: Lots of the needed features, easier to learn if you already used GA, integration with Google Play for conversion tracking (and more to come).
Not so much: No cohort analysis and no integration with iTunes for conversion (I don’t see that happening).
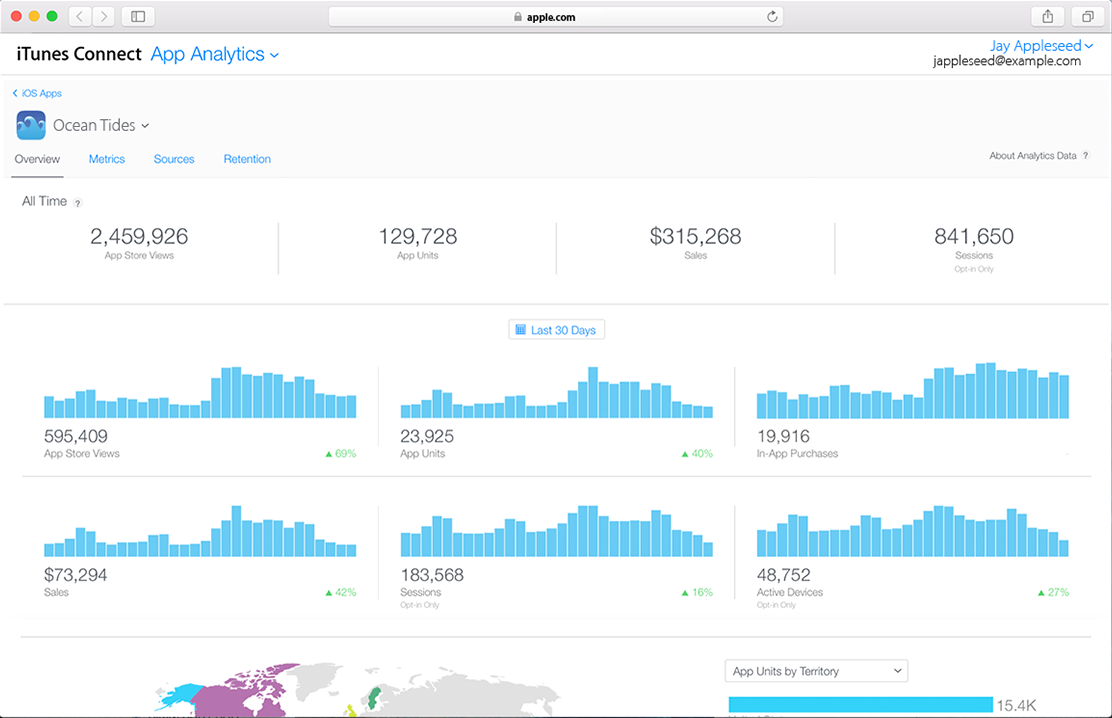
Apple App Analytics
Price: Free
Platforms: iOS
Apple introduced its App Analytics tool in 2015 to provide some answers on what’s happening on your app details listing and in your app.
Analytics has 3 key sets of data:
- App Store Data
- Sales Data
- Usage Data
It’s a nice and long awaited feature to be able to know how many App Store views your app is getting. The usage data is however still pretty limited compared to the other tools listed here and is most likely not going to be sufficient by itself:
- Installations
- Sessions
- Active devices
- Active devices in the last 30 days
- In-App purchases
An interesting piece of information you’ll find as well is user retention, sorted by week. Super helpful for showing you when users are dropping off, especially after an app update.
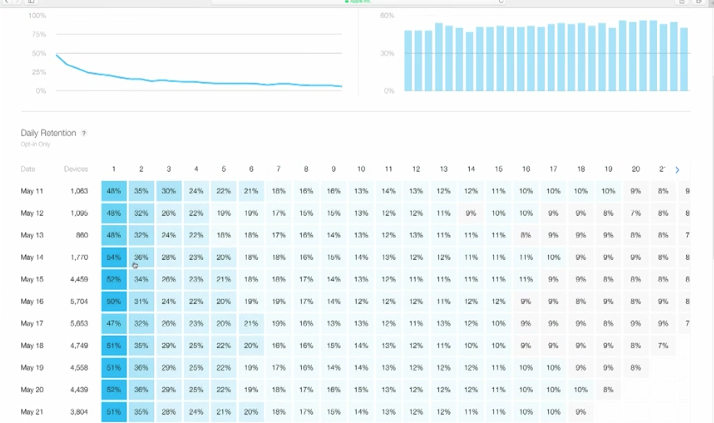
You don’t have anything to do to have, it’s built in iTunes Connect. For usage data like sessions for example, the data measured will only be the data from users that explicitly accepted to share their app usage stats in iOS.
Check out this WWDC15 presentation on how to get the most out of mobile app analytics. We hope that Apple will keep on improving this tool.
We like: The tool is well done, and diving into data and applying filters is quite easy. The “attribution analytics” are great to have, however this is not usage data.
Not so much: The in-app analytics data is still limited, especially for anything related to the actual user behaviors.
Mixpanel
Price: Freemium (see prices here)
Platforms: iOS, Android
Mixpanel offers event-based analytics tools: account creation, sharing, upgrade, purchase, etc. You have to define events and event properties for your app.
You can do things like:
- Track these events separately or create series of events (funnels).
- Use cohort analysis to see exactly how often users come back and engage with your application.
- Build complex queries based on events and demographics
- Tie mobile to web and vice versa
- If you have users’ info
- Tie data to a person
- “Explore” user segments and engage users via email/SMS/push notifications

Below is a video made by the MixPanel team to explain the tool:
Mixpanel lets you analyze your app retention by seeing how often your customers return and engage with your application. To get the full picture, it uses cohort analysis which groups your users by day, week or month based on a specific event.
Here’s more info:
In the free version, you’re limited to 25,000 data points / month. A data point is counted every time you track an event with Mixpanel. So, for a music app and if you track only songs played, that could be 2,500 users playing 10 songs each.
Mixpanel also has an “Activity Feed”, that lets you see a timeline of every action a user (when identified by a profile) takes in your app from day 1. They also integrated revenue tracking.
We like: Event-based and easy to create funnels, nice UI and allows in-depth analysis. Can tie web to mobile and cohort analysis.
Not so much: Limited in data points in free version, but you can get more (currently 175,000) by adding their badge to your website footer.
Facebook Analytics for Apps
Price: Free
Platforms: iOS, Android, Canvas
Facebook has their own mobile analytics SDK that will help you track the following:
- Events
- Funnels
- Cohorts
- Segments
- Integrations
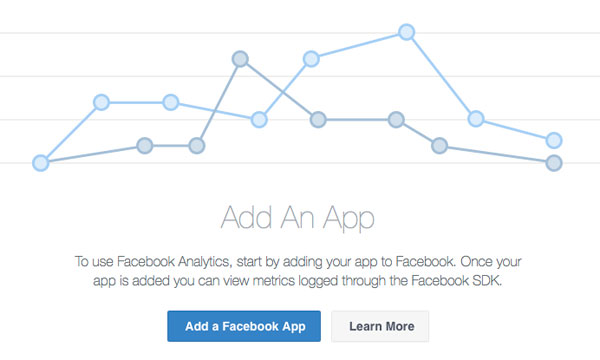
They make it easy to see what you are getting into, by providing a demo account that will give you access to the dashboard, with demo data. As we navigated through the dashboard, it is easy to use and very intuitive.
There was definitely an emphasis on simplicity, when they designed this analytics platform. That being said, there might not be enough information available here for people who need more complex analytics.
However, Analytics for Apps has all of the basic metrics that most app publishers need and can be a good start for people who don’t want to be overwhelmed.
To get started, you have to register your app with Facebook. Then your metrics can be logged through the Facebook SDK.
What we like: Squeaky clean interface, good step-by-step tutorials (with access to them in the right places), access to Facebook demographic data and a demo login.
Not so much: Tied heavily to the Facebook platform.
Amplitude
Price: Freemium (see prices here)
Stores: iOS, Android, Unity
Like Google Analytics and Mixpanel, Amplitude also provides analytics for both mobile and web. This integration helps you get a more complete picture of how people find and use your app, across both channels.
But since we are talking about mobile app analytics, let’s dig into their mobile offering. Like any other mobile analytics platform, the sign up process is easy and you can download and install the SDK in minutes.
You can track:
- Events
- User Activity
- Funnels
- Retention
- Revenue
- Behaviors
They emphasize behavioral cohorts (as they should) and they allow you to define actions that people take within your app, so you can discover key characteristics of people who do desired actions within your app.
One of the examples that they reference is Facebook’s study that showed that people who add at least seven friends in the first 10 days, were much more likely to be engaged users. After they discovered that, Facebook pushed hard to help people add at least seven friends when they sign up.
This is the kind of valuable information that you can uncover with behavioral cohorts.
What we like: The SQL option to get custom data. Although it is only available at the enterprise level, it does give power users the option of accessing data that is not otherwise available in the dashboard. If you have tried to get a report out of a system and you knew that the data was there, but the developers simply didn’t make it available, then you understand how powerful this feature is.
Not so much: Huge leap from free to $995 a month, UI could be better and a few tutorial videos in the platform would help with onboarding.
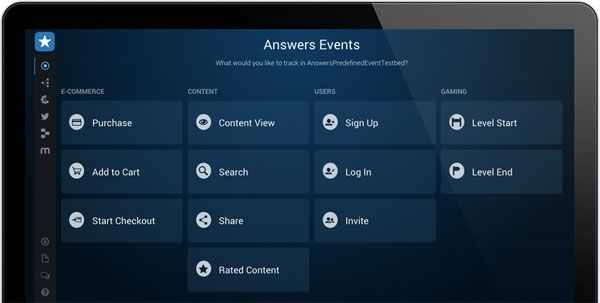
Answers on Fabric (Twitter)
Price: Free
Platforms: iOS, Android
The goal of Fabric is to get all of the best app SDKs under one roof. This means: crash reporting, analytics, payments, growth, infrastructure and more.
Their analytics offering is called Answers and it provides a real-time mobile analytics. Their events tracking provides a core list of the most popular events that most app publishers track.
To see what makes Answers unique, watch this video:
What we like: Great UI and it is convenient that there are several integrated app SDKs available on Fabric.
Not so much: Like Facebook app analytics, Twitter’s best interest will always take priority.
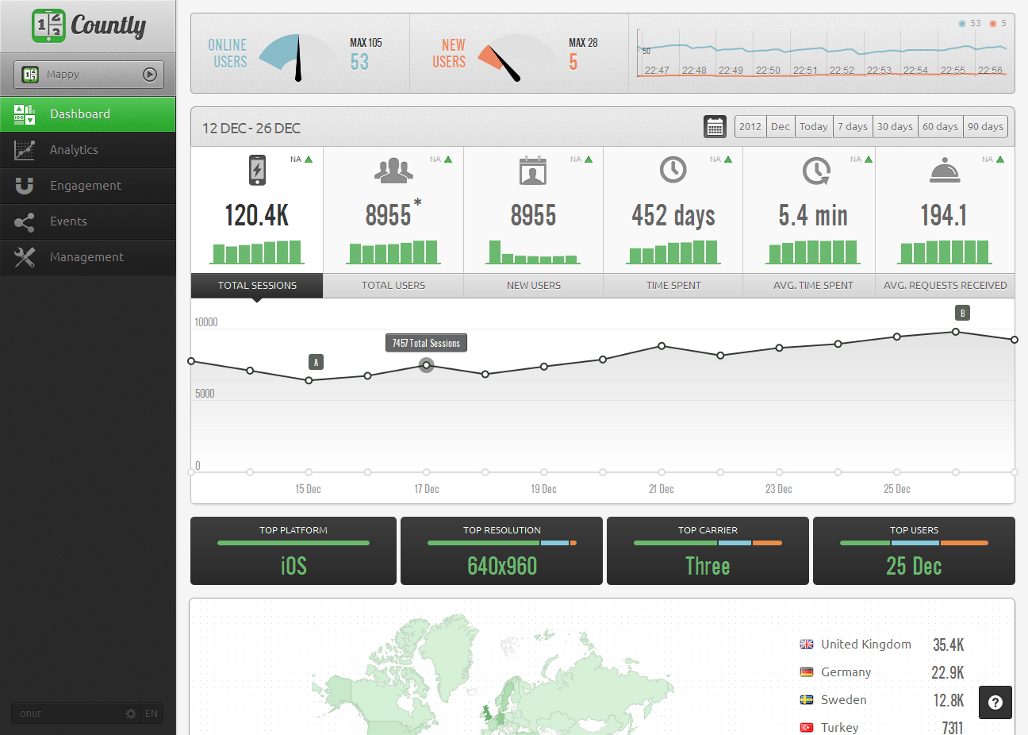
Countly
Price: Free if self hosted (open source)
Platforms: iOS, Android, Windows Phone, Blackberry
Countly might not be one of the leading analytic tools but it has a unique positioning, a great UI and a cool design. It is a real-time, open source mobile analytics application that you can host on your own server. Since their launch the team has added an Entreprise Edition and a Cloud Edition.
The dashboard is really easy to use, with pretty much every info at a glance or at a click: sessions, new users, time spent, events served, etc.
For each app, you can get info on:
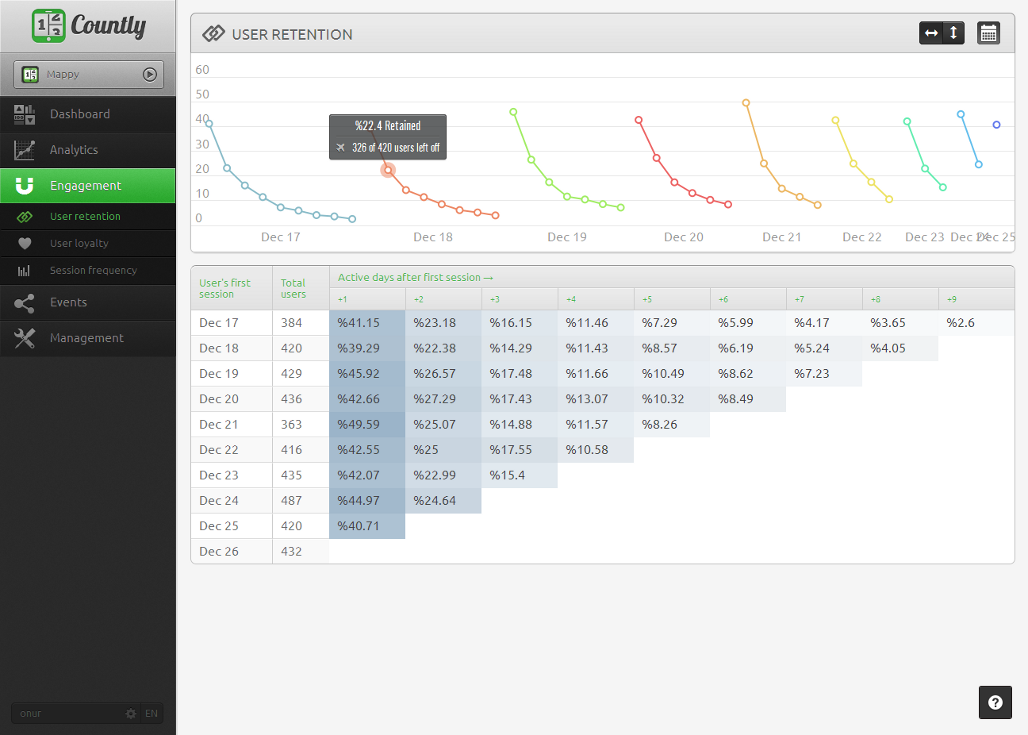
- Users and Users Loyalty
- Sessions and Session Frequency
- Countries
- Devices and App Versions
- Carriers and Platforms
You can also track events (and use segmentation) and sets of events (i.e funnels) that you define from the app. If you want to segment (country, app version, platform), that means you have to think about it before hand (in your app code).
We like: Awesome UI/design and the fact that they offer an open source analytics option.
Not so much: Segment from within the app (but that’s also for performance reasons).
Appsee
Price: Free trial
Platforms: iOS, Android
AppSee has quite a unique approach. It is a visual in-app analytics platform that helps measuring, understanding (and therefore improve) user experience. Not only you get the “usual” analytics and stats, but you get some “qualitative” information on users’ behaviors as well.
Watch recordings of real users sessions to understand what exactly happens: for example, why users abandon the registration screen. You can control the ratio of recorded users or target specific users.
You also have access to Heatmaps to understand on which parts of your app (screens) users focus the most.
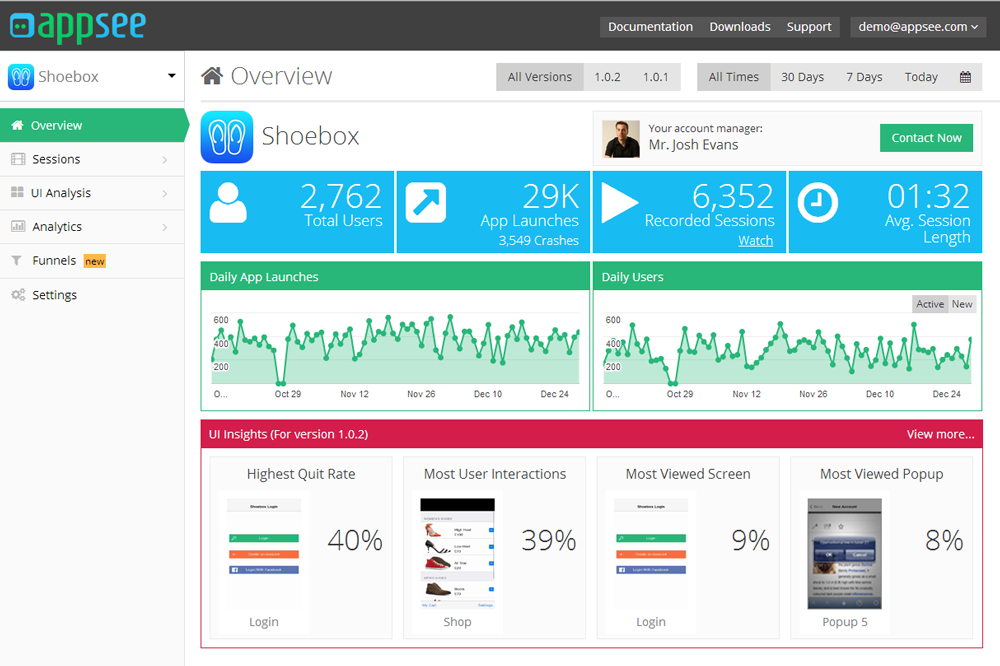
AppSee automatically creates events based on the user interaction with your app, and you can create conversion funnels based on these events or specific screens.
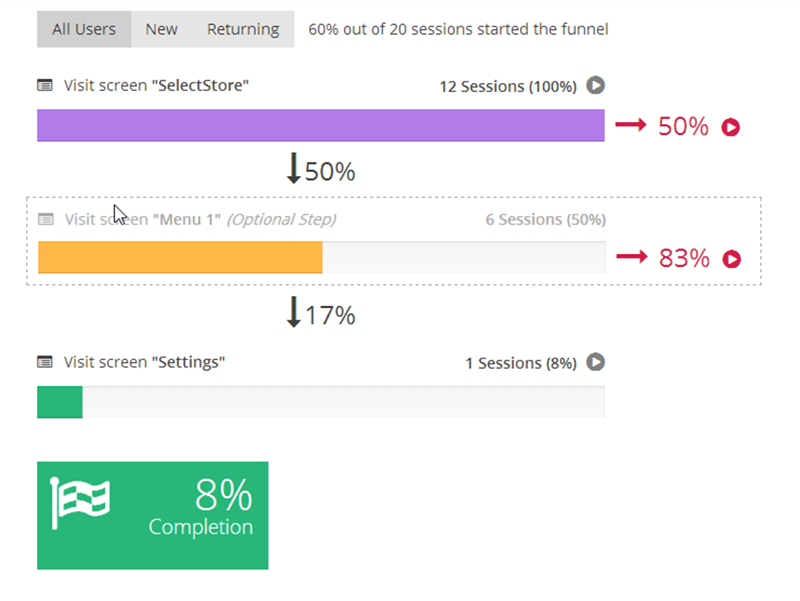
You see users stopping at one step of the funnel? Just watch the corresponding user recordings to find out why so you can fix it.
Smart.
Appsee provides a free 14-day trial that includes all the features. The paid plans are tailored to the customers’ needs and based on the supported platforms, number of tracked sessions and apps.
We like: Unique visual and qualitative approach.
Not so much: Hard to find some things.
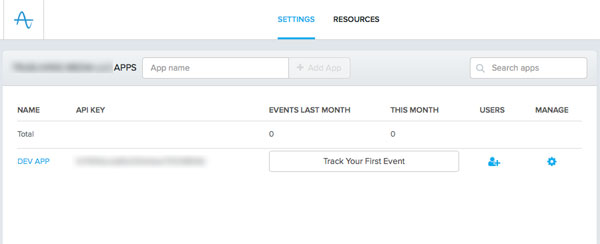
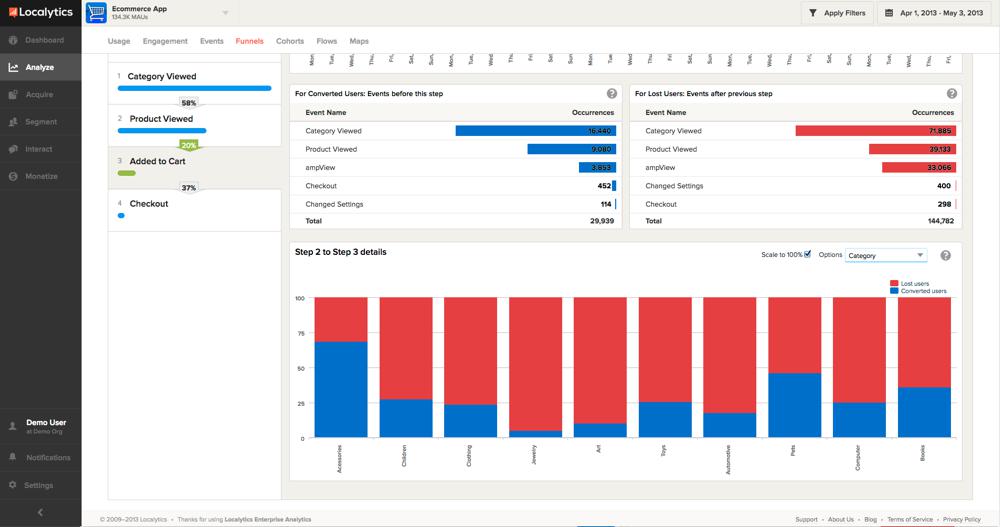
Localytics
Price: Freemium (see prices here)
Platforms: iOS, Android, Windows Phone, BlackBerry, HTML5
Localytics ties marketing/acquisition tools to analytics.
On the first screen, once you’ve added your apps, Localytics presents you an overview of each one with the number of sessions or users. In the premium/entreprise versions you can compare your apps with various criterias (new vs. returning, sessions, users, etc.) and also build your own queries to get a .csv file.
They’ve extended what’s available in the free version (less than 10k monthly active users or 500k data points) and you can get for each app:
- App usage and reports (by location, device, carrier, app version, unique users)
- Users and sessions (time periods and new vs. returning)
- Heatmaps
- Screenflow
- Funnels
- Cohort-based retention
- Segments
- Customer Lifetime Value (LTV)
The idea behind Localytics is to take action based on the insight you get, so they also have a marketing add-on lets you target customers that do specific actions for ads, push messaging or in-app messaging.
We like: Easy to use, unlimited apps in free version and cohort-based retention.
Not so much: Limited data points or monthly active users in free version (but hey, they have to live right?).
Apsalar – ApScience
Price: Free
Platform: iOS, Android
Apsalar, quite like Localytics, wants to give you an All-In-One solution: track and measure, segment and analyze, so you can advertise.
The customizable dashboard lets you choose the data you want to see at first glance.

You can create:
- Events (unlimited event tracking in the free plan)
- Funnels, including across multiple apps.
- Real-time cohorts, to measure engagement of users across time
- Revenue tracking
")
You can also segment your users based on these events, funnels and cohorts.
In addition, Apsalar has a free tool to measure performance and ROI/LTV of acquisition campaigns. Another tool, still in private beta, allows developers to target specific users when advertising.
We like: Analytics across multiple apps and real-time cohorts.
Not so much: They don’t answer our emails.
So here are most of your options in order to know how, when, where and by what kind of audience your app is used. Based on the data you’ll get and the tracking of your downloads and revenues, you can adjust your app marketing and improve your app/game.
Did we forget any major free or affordable tools for mobile app analytics? Have you tried any of these and would like to share your experience? What do you track? Let us know in the comments!
Follow Apptamin on Twitter
Follow me on Twitter

Great article regarding app analytics and its tools. I would also recommend CleverTap which is a mobile marketing platform providing app analytics and mobile app metrics to gain more user engagement and win back users
Thank you for this useful article, it really helped me to analyze my apps performance.
Hi Sylvain,
Thank you very much for this information. I was looking for this tools from last 1 week and finally got it. Please provide some more tool if possible !
Flurry now has a restricted version which helps you be COPPA compliant if your app is targeted or can be used by kids under 13.
http://support.flurry.com/index.php?title=Analytics/Overview/RestrictedFeatureSet
Hi Sylvain, thanks for the article. It’s a nice survey of the various mobile app analytics services that are available and does a good job delving into the strategy and importance of using them. We use Flurry Analytics (the first service described in your article) in our iOS apps and have been pleased with the results. To make the most of this service we even developed an iOS app called Flutter that allows users to keep track of their Flurry Analytics data on the go. Hope this is a good resource for your readers:
http://durbinware.com/products/flutter
Hi Sylvain,
In your list, you haven’t mentionned AdXTracking. What do you think about this software?
Thank you!
Alexis 1992 I didn’t know it..Will add it to our list of tools when time allows: https://www.apptamin.com/blog/app-developer-tools/
From HackerNews: http://keen.io/ (build analytics features directly into your apps) is another analytics service not mentioned on this list.
One of our followers on twitter also mentioned piwik.org, which is Real-time and Open Source.