The step-by-step guide to pre-post analysis for ASO with iTunes Connect App Analytics
App Store Optimization (ASO)
March 8, 2018

There is not any A/B testing tool in iTunes connect.
Without something like Google experiment, you’re therefore left with having to use 3rd party A/B testing tools like Splitmetrics.
But you might not want to invest in these tools just yet, or be interested in evaluating the “live” impact of a change to your App Store listing.
In this step-by -step guide we detail how you can best assess the impact of any change during your App Store Optimization efforts, from a new icon to an updated App Store title for your app.
We’re an app video production agency so of course we often refer to a change regarding the App Store Preview videos.
- Before going further
- Apple Glossary
- Which dates and periods to choose
- Source types, platform version and other filters
- Which metrics to measure
- Calculating the Click-Through Rate (CTR)
- Calculating the Conversion Rate (CVR Impressions -> App Units)
- Calculating the Conversion Rate (CVR Product Page Views -> App Units)
- Analyzing the results
- A different pre-post analysis: paid UA and attribution tool
- Conclusion
The general idea of the pre-post analysis is to look at a couple of metrics in iTunes Analytics and compare before vs. after adding the video. It’s important to compare the results for at least 7 days (7 days before, 7 days after) to account for potential changes in behavior depending on the weekday or weekend.
Note: as mentioned there is a focus on video in this post, but the pre-post analysis method explains here can work with any change in your app store listing for which you’re trying to assess the impact.


Before going further
Because this is not an A/B test, you especially want to keep marketing/acquisition efforts as consistent as possible and not change anythisaveng else (icon, description, screenshots and keywords) so it doesn’t change the results too much.
You also want to monitor any large externalities: features by Apple, PR from a top website, etc. The goal is that only one thing changes: in our case, video vs. no video.
Apple Glossary
Let’s first take a look at the official definitions of the metrics, measures and sources given by Apple in iTunes analytics.
This is important because they determine the way we analyze the conversion rate before and after the change.
Metrics and measures
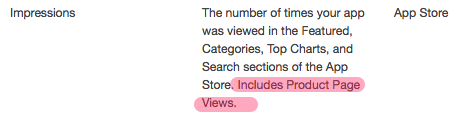
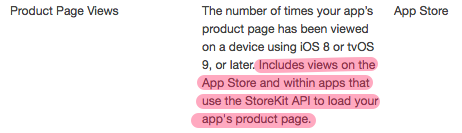
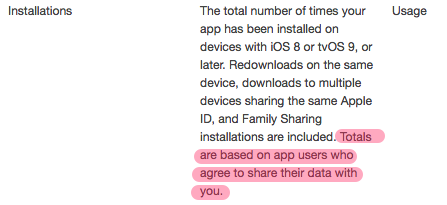
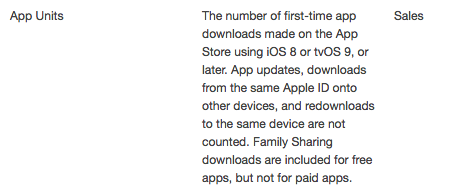
Source types
Which dates?
iTunes App Analytics gives you the possibility to define the range for which you want to look at the data.
Here our goal is to assess the impact of a change in your App Store listing (adding a video). So you want to get a full week of data (7 days) before the day of the change and a full week of data (7 days) after the day of the change. This is very important, as there can be a huge difference in install conversion depending on the day.
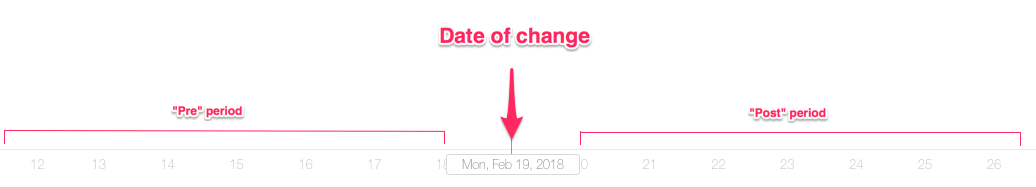
Alternatively you can look at the data for the week before the change vs. the data for the week after the change.
If there wasn’t any other release (and external “changes” – features, PR, etc.), you can also take larger periods of time before/after as long as each period contains the same days total (example: 2 weeks before, 2 weeks after for example).
Source type, Platform version and others
Browse or search?
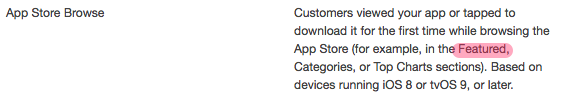
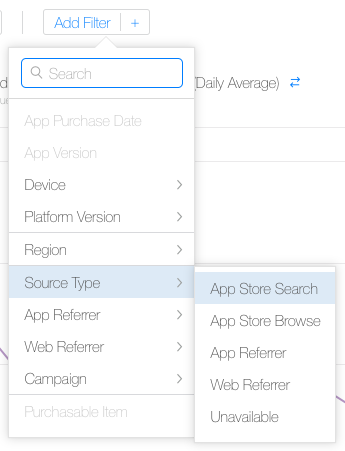
As you can see in the definitions of the App Store visitor sources above, in iTunes analytics you can filter by visitors that came browsing in the App Store and visitors that find your app through a search.
No matter the metric you measure (see below), it is interesting to filter through both Source Types. The reason is that these are 2 sources of visitors that may not be searching for your app specifically. With the exception of brand searches of course. In the case of App Store Browse, there might even not be any specific intent at all.
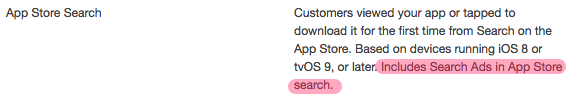
If like in our case you are testing the impact of a video, you can’t ignore the App Store Search Source Type. Video is indeed displayed in both the search results and on the Product Page (App Store listing). As mentioned App Store Search also includes Search Ads so keep this in mind (the video can also be displayed in Search Ads).

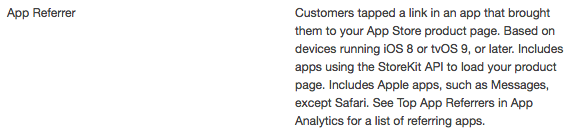
Note: there are other source types (App referrer, Web Referrer, Unavailable). But because we want to focus on “organic” installs as much as possible (remember: Search Ads are still in the App Store Search source type) we are not looking at them here.
Which OS?
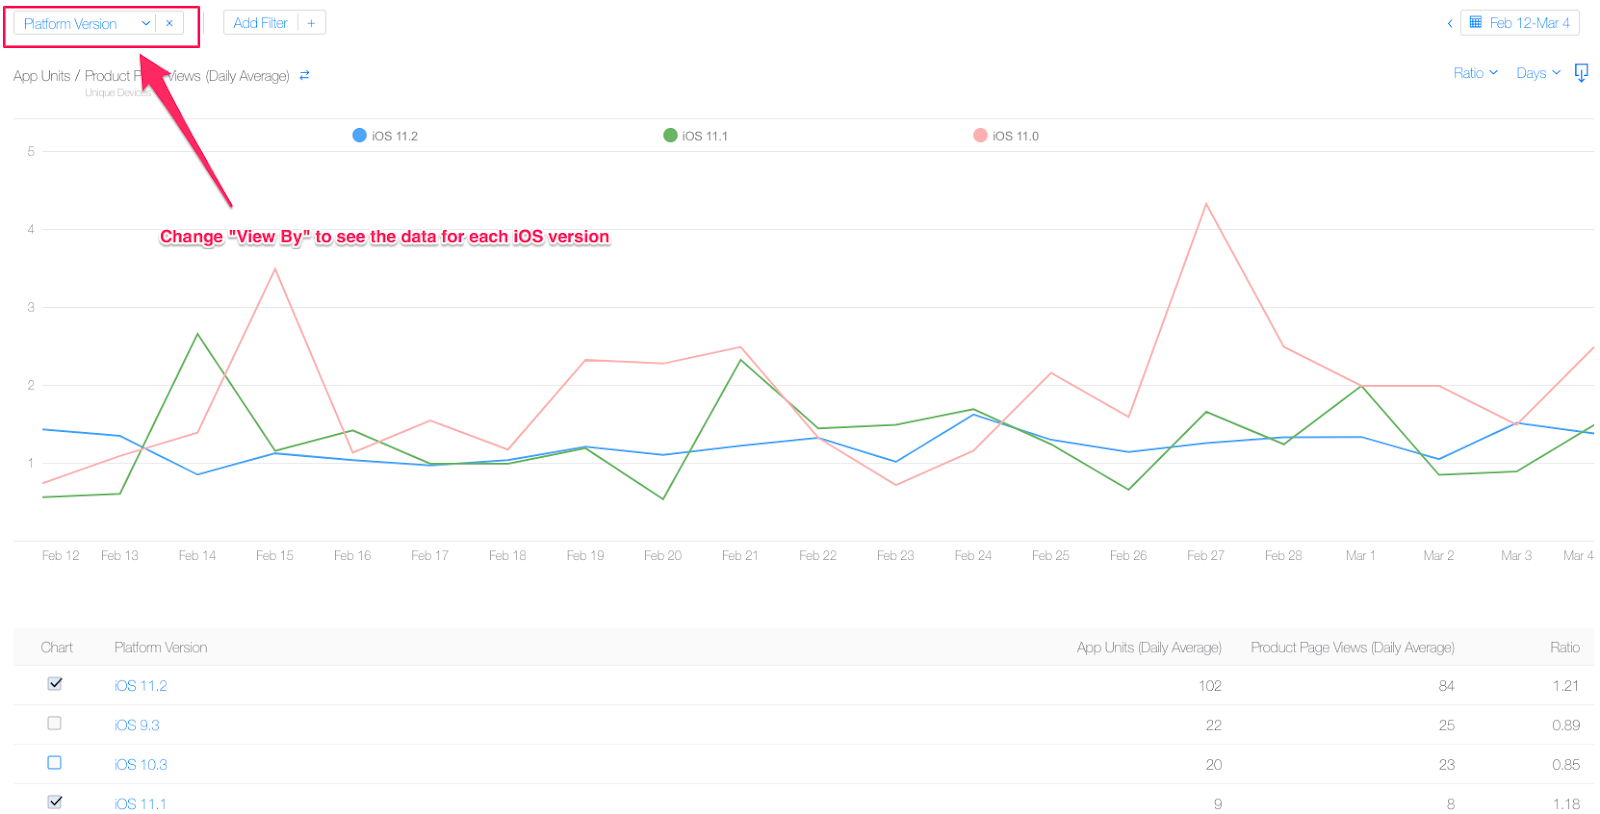
You can also filter by Platform version. The idea here is to get a view of the metrics only for users that have iOS 10 or only users that have iOS 11.
You can play around with this as well. We recommend to focus on users that have iOS 11 as they are the ones that see the new iOS 11 App Store design that will be used going forward (until the next update from Apple of course).
Unfortunately, because filters in iTunes Connect App Analytics only allow you to select one platform version (iOS 11.0, or iOS 11.1, etc.) you will have to use the “View By” section and export the data to be able to get numbers for all iOS 11 users.
Which Metrics to measure
The CTR and CVRs in this article are calculated via the data you can find in iTunes Connect App Analytics, in the Metrics tab.

What you want to do is:
- download the data (.csv file) from the view you’re seeing in iTunes Connect App Analytics;
- open it with Excel (or with Google Sheets – it automatically puts the data in columns);
- copy/paste it into the right sheets/tabs (called “Data”) of your copy of our spreadsheet;
- Check out the “Comparison” sheets/tabs.
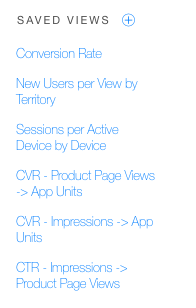
Tip: as you go through your first pre-post analysis, save each important view in the “Saved View” panel at the bottom left. Between this and the Google Sheet above, this should make each analysis much faster!
2 ways to calculate the Install Rate (or Conversion Rate – CVR)
Whether following a search or when browsing, the Install Rate or CVR is about measuring the percentage of visitors that tap the “Get” button (or Price button) to download your app.
As this button is present outside of the Product Page, it means that with the iTune Analytics data there is unfortunately no way to differentiate these 2 things:
- Conversion Rate directly from the Search Results
- Conversion Rate only from the Product Page
What we’re looking at for the Install Rate / CVR can therefore be either:
- CVR Impressions -> App Units
- CVR Product Page Views -> App Units
Because installs (App Units) can come either after a Product Page View or an Impression and because Impressions include Product Page Views, you can NOT assume that Impressions -> App Units will give you the CVR from the search results and that Product Page Views -> App Units will give you the CVR from the App Store listing.
Do you need to measure all the possible combinations?
Depending on what the change to your App Store data is (example: video vs. no video, new video vs. previous video, etc.), the CTR and which CVR to calculate in priority might vary. For example:
- If you change something that is only on your Product Page (example: adding a 2nd App Preview), then the CTR and CVR from Impressions are less relevant than the CVR from Product Page Views.
- If you change something that is displayed in the Search Results as well (example: adding a video when there was none before, changing your icon, etc.) then the CTR, the CVR from Impressions and the CVR from Product Page views are all very relevant.
The change for which you’re trying to assess the impact also defines which filter to choose (Source Type like Search or Browse, etc.) or view (Platform version to get iOS 11 users only). For example:
- Video does not appear when browsing the App Store by Category, so calculating CVRs for App Store Browse is less relevant for a video pre-post analysis (i.e selecting App Store Browse in the filter is will give you a very partial view of things).
- Video does not autoplay for users that do not have iOS 11 or later, therefore the impact of video will not be the same for these users. There are also a few other edge cases where there is no autoplay, even for iOS 11 users (low battery, turned off in settings, etc.).
If your change is only for one localization/territory, then this is something you may want to “filter by” as well to get more relevant results.
That said, it’s easy to get lost with the different combinations possible, so start by calculating with no filter and no specific views like explained at the start of each section.
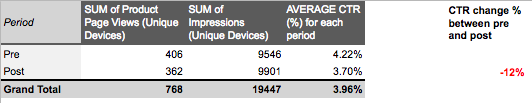
Calculating the Click-Through-Rate (CTR)
Because Impressions include Product Page Views (see Apple Glossary above: people that see your Product Page are counted twice) the Click-Through-Rate (CTR) here is not exactly the same as what you usually get (for ads for example).
But an increase in the CTR we’re about to calculate definitely gives you an indication that more people go to the product page after seeing the app, whether when browsing or searching. It is therefore a key metric. At the same time it is still a win if you get an install just from an impression in the Search Results, even though it doesn’t reflect positively on the CTR.
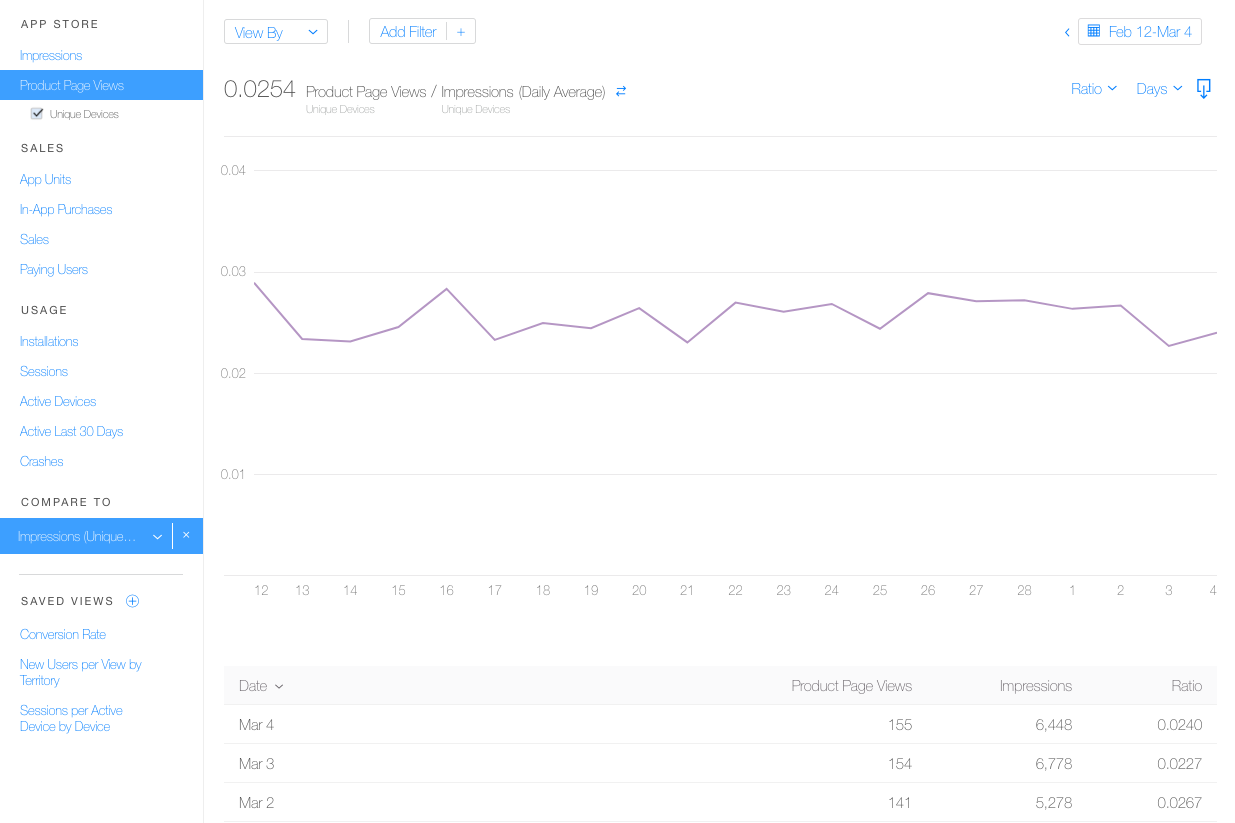
What we’re looking out for the CTR is Impressions -> Product Page Views.
So in iTunes Analytics you want to select “Product Page views” (with “Unique devices” checked) then “Impressions -> Unique Devices” in the COMPARE TO section.
Note: It’s very important to check “Unique Devices”, otherwise visitors are counted several times (and the difference in count is huge – about 40% more in our case).
Once you do, you’ll see a chart and a table with Product Page Views, Impressions and Ratio for each day of the period you selected.
Calculation for all Platform Versions (all OS) and Source Types
For now, we won’t filter the data by source type.
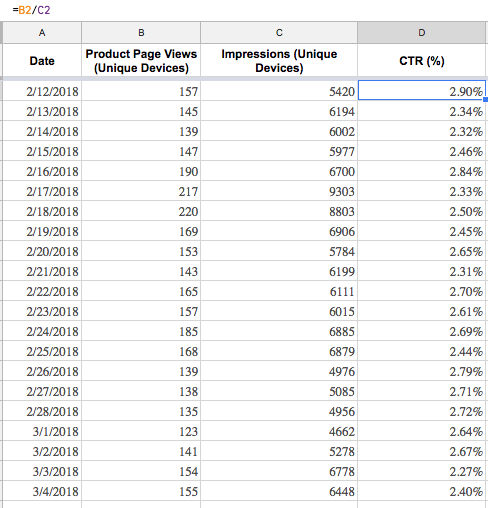
You can download or copy the data for each day and input it in Excel or a Google Spreadsheet. You’ll see that when downloading the csv file from iTunes Connect the ratio is not in there. So add a column for the CTR % which is calculated this way (obviously if the data format is set as a % like below you do not need to multiply by 100):
Next you want to add a column and define the period before the change (“Pre”) and the period after the change (“Post”).
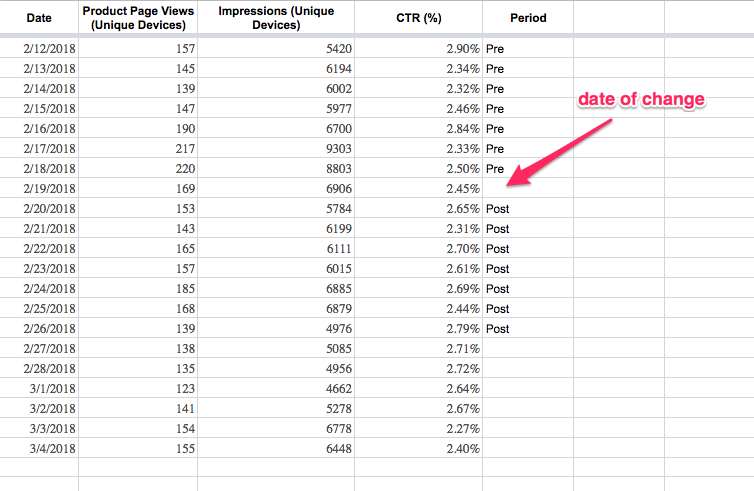
Our goal is to compare the increase/decrease in CTR before the change and after the change, so we now want to calculate the average CTR pre and post change. You can do this easily with the Average function or using a Pivot table like below.
The % of change in CTR can then be calculated like this:
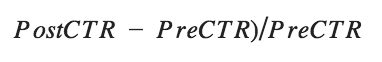
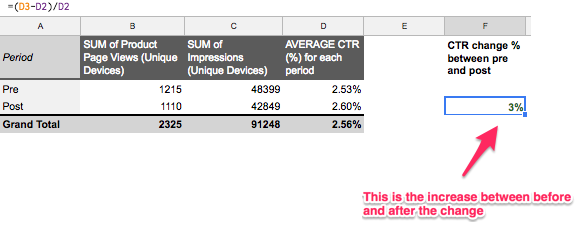
Here we have a 3% increase after the change, which is definitely not significant. Be careful about drawing conclusions with any change that would be within single digits.
Calculation by Source Type
Let’s take a look at what we get when we filter data by Source type to see only visitors coming from App Store Search.
Repeat the same steps: download the data, input it in Excel/Gsheet and calculate the CTR change between before and after the change.
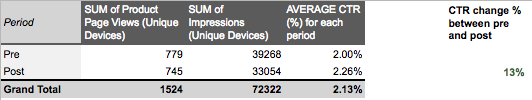
The % of change here is more significant, but is still to be considered in its context (i.e how are the other metrics).
Here is what we have if we filter only by App Store Browse:

Keep in mind you can not only look at the CTR by itself to make a decision: more people on your Product Page (App Store listing) is not interesting if it doesn’t bring you more downloads.
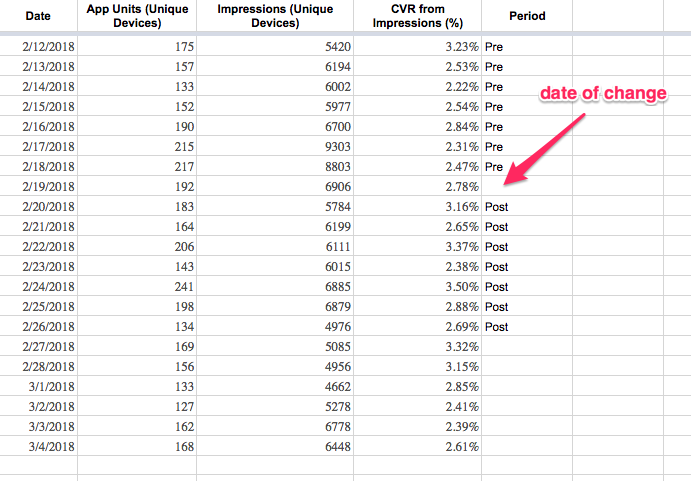
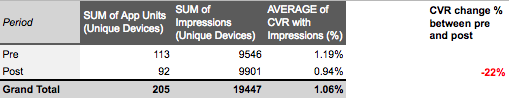
Calculating the Conversion Rate (CVR) Impressions -> App Units
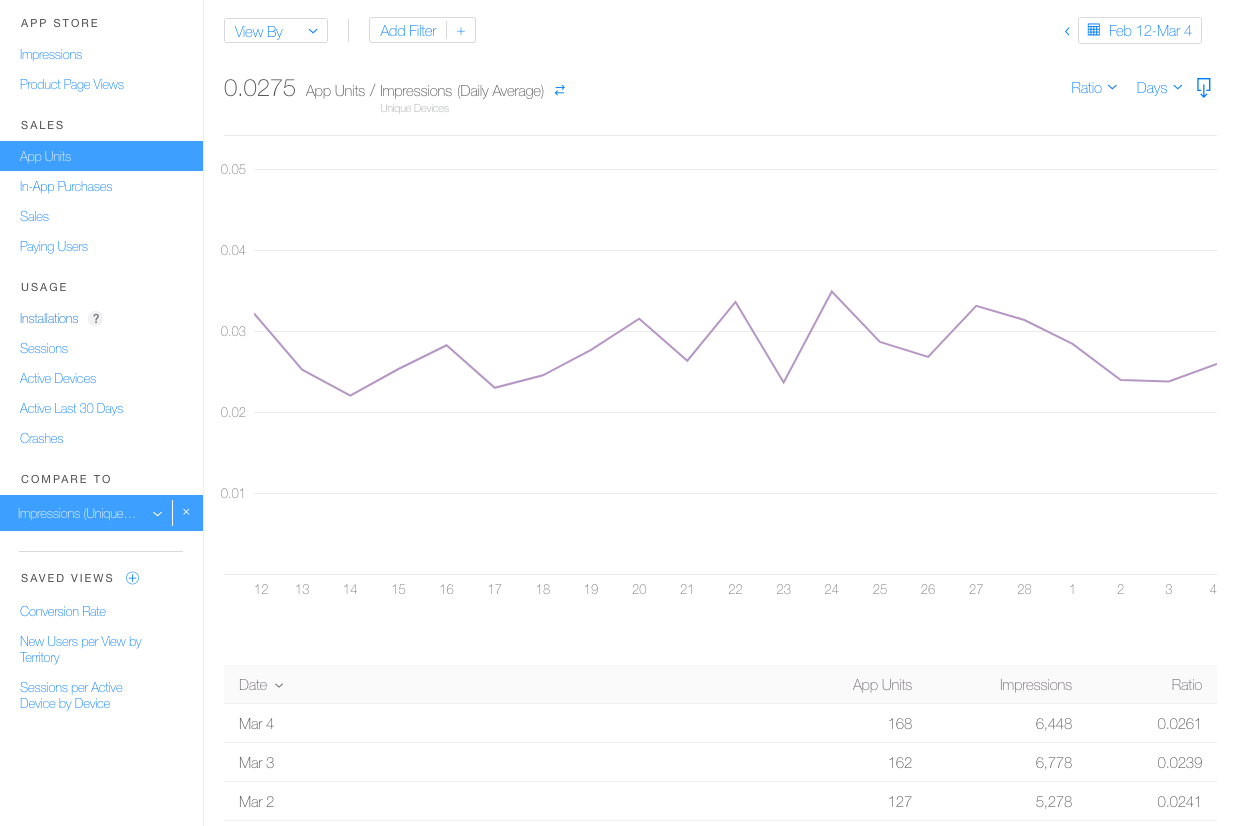
In iTunes Analytics you want to select “App Units” then “Impressions -> Unique Devices” in the COMPARE TO section.
You’ll then see a chart and a table with App Units, Impressions and Ratio for each day of the selected period.
Calculation for all Platform Versions (all OS) and Source Types
Let’s start by not filtering the data (and looking at all iOS users), and we’ll later look at App Store Search data vs. App Store Browse data.
To get the actual Install Rate / CVR percentage relating to Impressions the “formula” is:
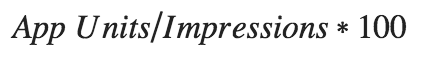
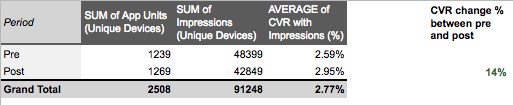
Like for the CTR, download or copy the data into your spreadsheet and indicate the period (“Pre” or “Post”) for each day.
Calculate the CVR average or use a pivot table, and calculate the CVR change %.
Calculation by Source Type
Rinse and repeat but with a filter for App Store Search then a filter for App Store Browse.
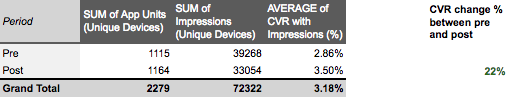
Calculation for iOS 11 only
Now if you want to only take into account users on iOS 11, you need to select “View BY” -> “Platform Versions” in App Analytics.
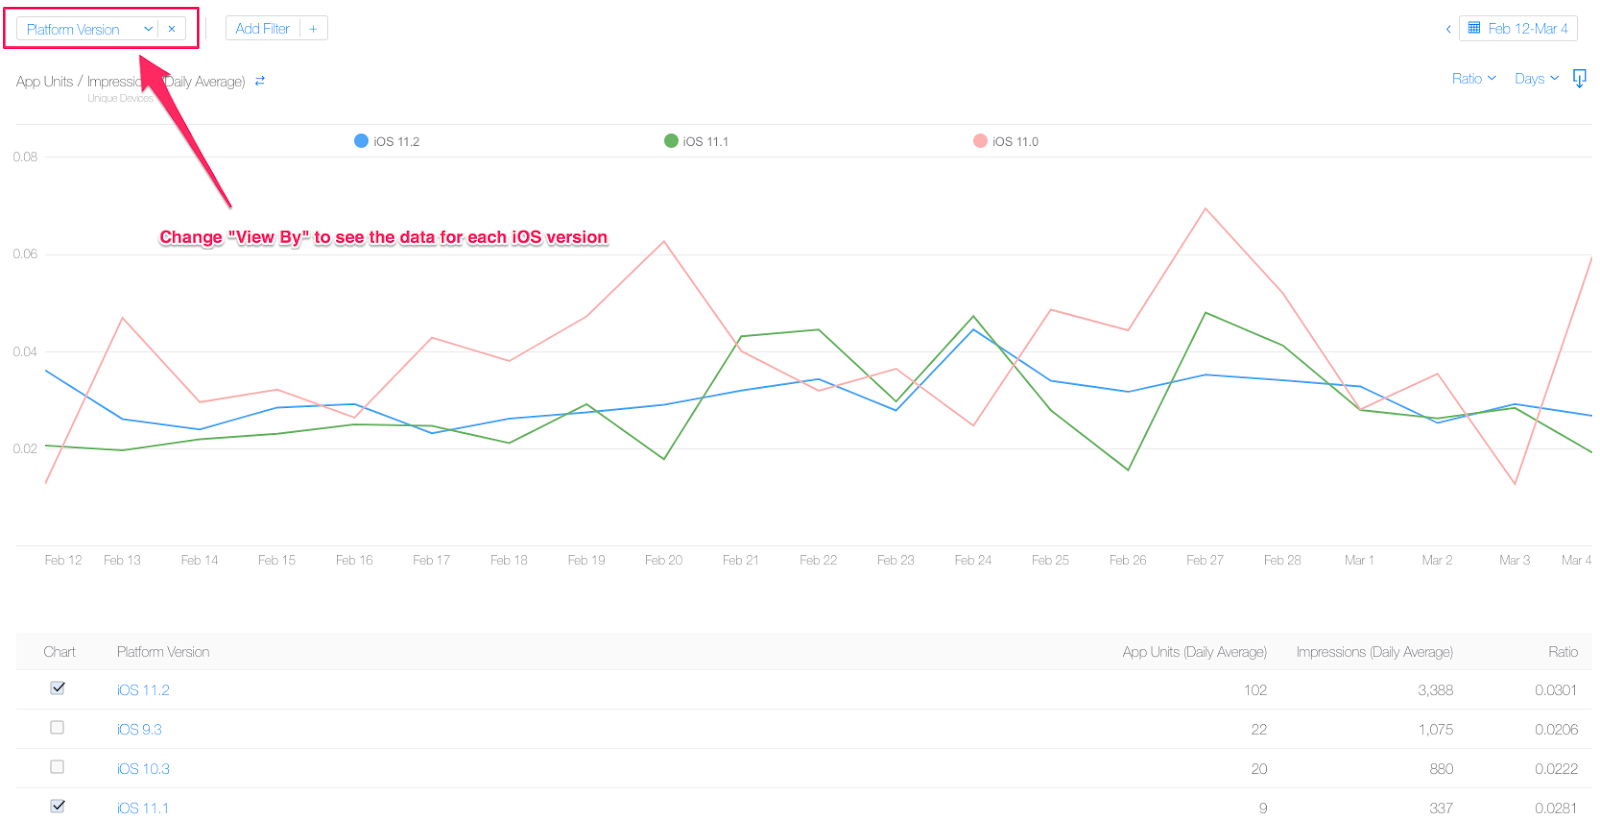
Directly in App Analytics you won’t see the data for each day.
But if you download it (csv file) you can then keep only the iOS 11.X data and put it in your spreadsheet. Then, calculate for each day the number of total iOS 11 App Units and total iOS 11 Impressions so you can get the conversion rate for each day for iOS 11 visitors only.
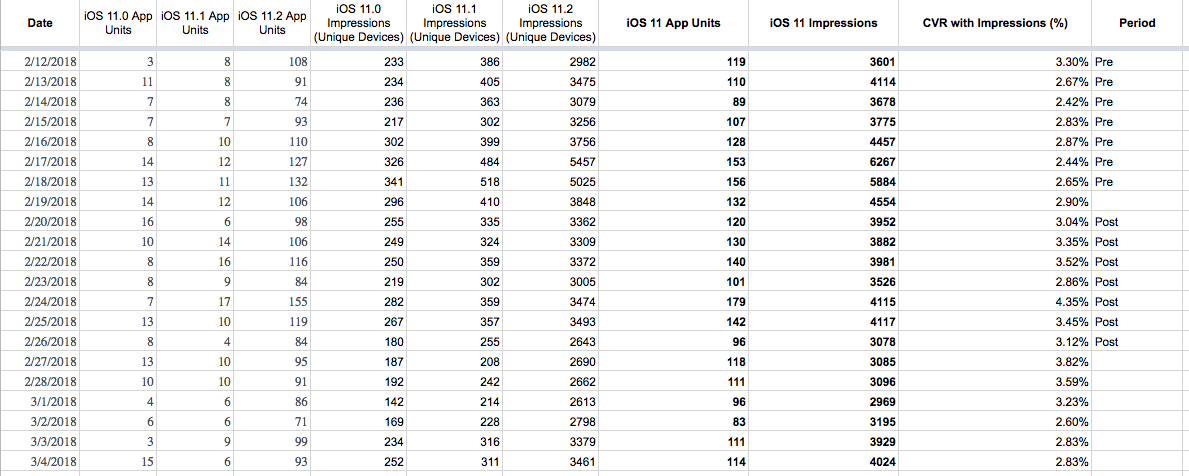
And you guessed it, we then use the average CVR for each period to find the conversion rate percentage change between before and after the change.
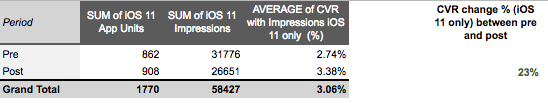
iOS 11 only data is usually the most relevant because iPhone users are quick to adopt new versions of iOS.
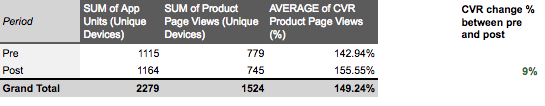
Calculating the Conversion Rate (CVR) Porduct Page Views -> App Units
Note: Again, people can download your app both from the search results and from the product page. So the calculation we’re about to make DOES NOT give you the conversion rate of ONLY people that downloaded your app from the Product Page (App Listing). This also explains why your conversion rate calculated this way tends to be > 100%.
Note 2: Product Page Views include views “within apps that use the StoreKit API”, so that includes people that tap on the video from a Facebook or YouTube ad. Here is an example of how this could happen:
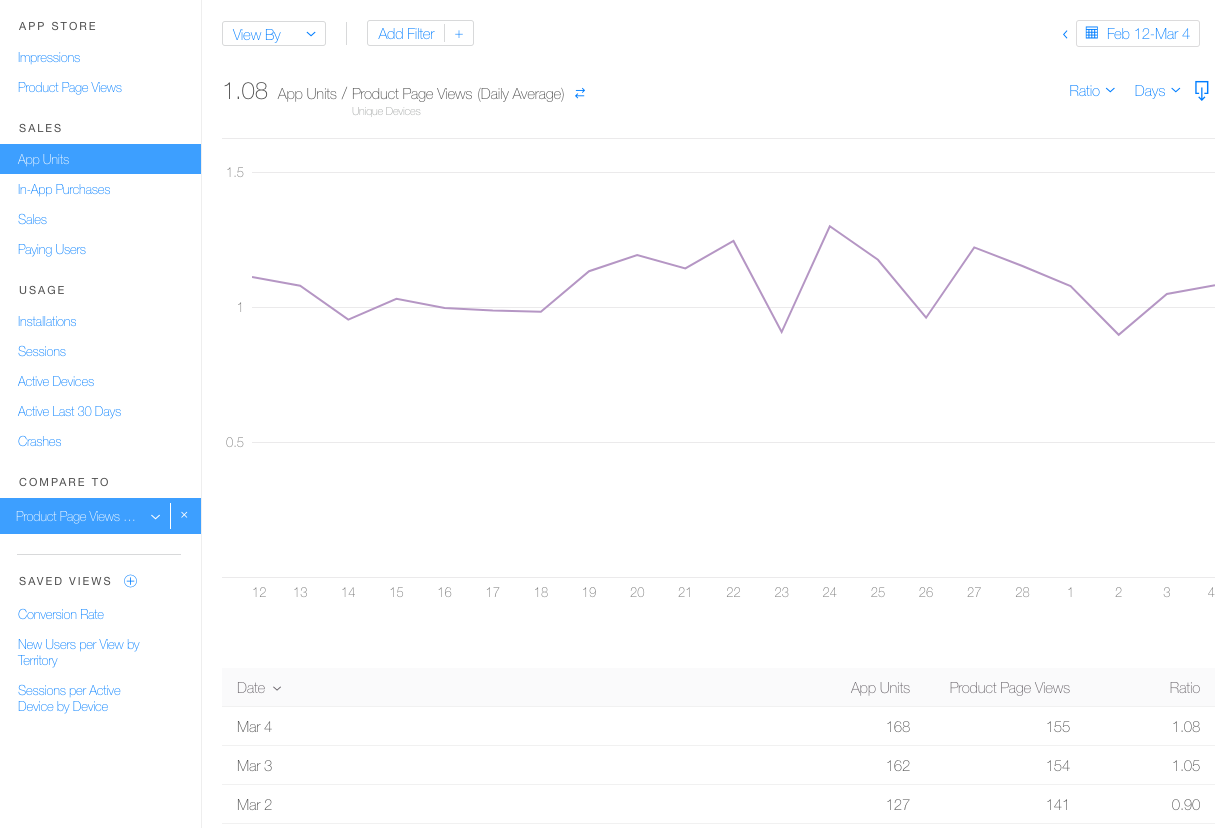
In iTunes Analytics you want to select “App Units” then “Product Page Views -> Unique Devices” in the COMPARE TO section.
You should get something like below, with a chart and data for App Units, Product Page Views and the Ratio for each day.
Calculation for all Platform Versions (all OS)
Here too let’s start with no Filter or “View By”.
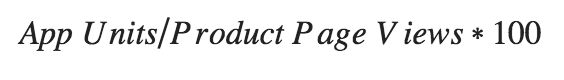
To get the actual Install Rate / CVR percentage relating to Product Page Views the “formula” is:
Download/copy the data into your spreadsheet and indicate the period for each day.
Now let’s calculate the percentage of change in CVR.
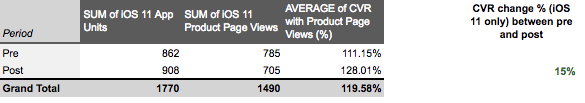
Calculation for iOS 11 only
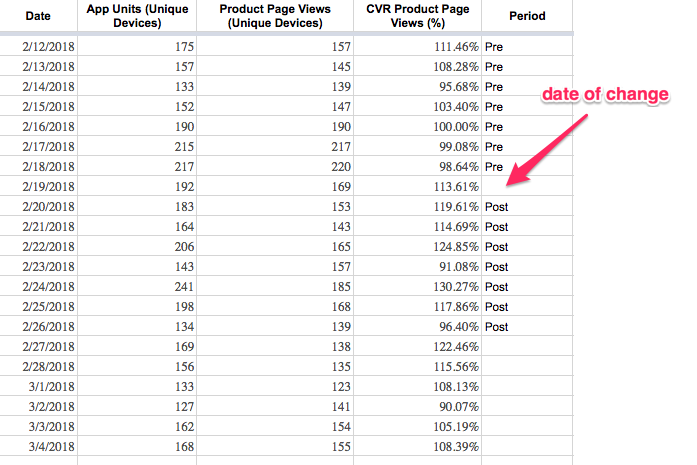
Let’s have a look at the data for iOS 11 only by selecting “Platform Version” in “View By” and keeping only the numbers for iOS 11 versions.
Here too you need to download the data to have it by day.
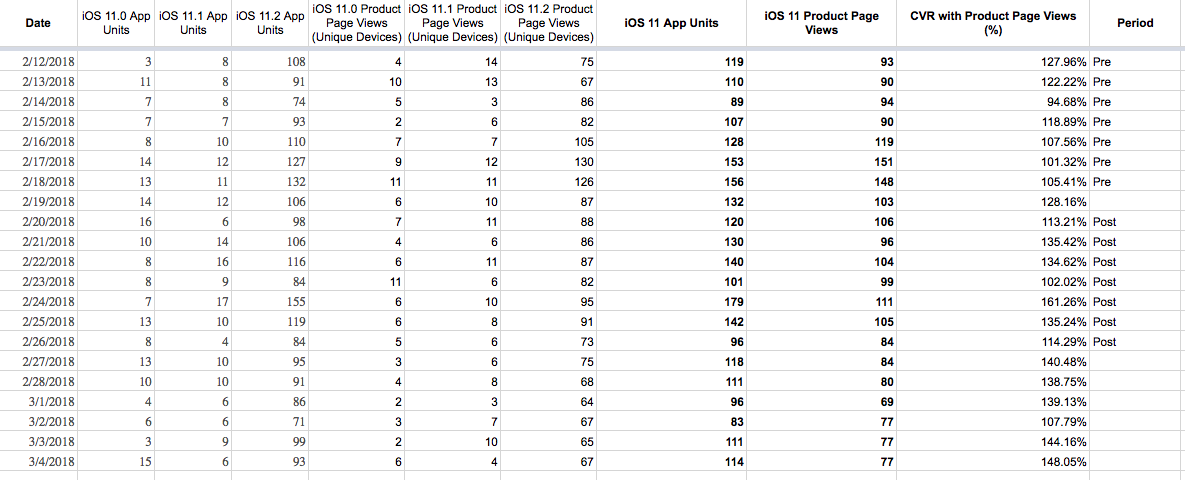
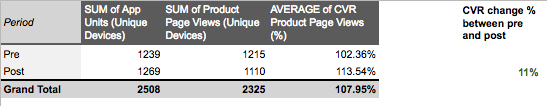
We then calculate the change in conversion rate between the “Pre” period and the “Post” period.
Analyzing the results
As mentioned, be careful about drawing conclusions for any CTR/CVR change that is not > 10%.
This is not an A/B test so you also need to keep in mind that a lot of external factors can skew the results. Things like: a feature, an increase in acquisition efforts, etc. The context of each period is therefore very important.
That being said, equipped with these new metrics you can try and see what would have been the impact on downloads.
A different pre-post analysis – Paid Acquisition and Attribution tool
There is another way to assess the impact of the App Store Preview video that Thomas Petit from 8fit shared with us.
You can look at some of your paid acquisition sources that you “know well”: the campaigns where you’re the most confident about the number of clicks and installs you’re going to get. The ones that have been stable for a while. It can be campaigns on Facebook, Instagram, on Outbrain, etc.
You can get the data from your attribution tool (like Adjust) and get the install rate by doing “number of installs”/”number of taps”. You then compare this install rate before the video and after the video.
Here are the pros and cons that Thomas shared about this method:
- Pro: “real” data without some of the bias mentioned before (Impressions vs Product Page Views) so usually more stable. Critically relevant if one does a lot of paid UA.
- Con: no data on organics… Plus you also need very stable campaigns, don’t do it on all paid UA combined but specific campaigns only.
He recommends to analyze both the organic method from iTunes Connect and the paid method from paid clicks-tracked installs below.
Conclusion
One of the best ways to analyze the impact of your ASO efforts for iOS apps is to do a pre-post analysis like detailed in this post.
For this, you need to measure the change in percentage for the metrics below:
- Click-Through-Rate from Impressions -> Product Page Views
- Conversion Rate from Impressions -> App Units
- Conversion Rate from Product Page Views -> App units
Because of the way Apple measures the initial metrics (Impressions, Product Page Views, App Units) as well as the Source Types (App Store Browse, App Store Search, etc.), it’s important to understand the nuances before drawing any conclusions about the impact of a change you’re making to your App Store listing.
By following this step-by-step guide you should be able to improve your App Store listing and get more downloads.
Have you done this kind of pre-post analysis before for your app(s)? Let us know in the comments how it went and if you have any feedback!
Follow Apptamin on Twitter
Follow me on Twitter

Very informative and helpful article! I’m glad you wrote this ’cause now I have a guide on how to implement ASO for our app. Thanks!
You’re welcome! Glad it’s helpful
Hi Sylvain,
Thank you for this great post, I have one question – How come you’ve decided to look at the average CTR/CVR % to find the increase/decrease rather than using the total impressions and page views in the time period to find the CTR for example and then looking at the % increase/decrease? Are both methods valid?
Many thanks
Hi Cameron – yes both methods are valid 🙂
Good article! If I might suggest a quick fix…
The CTR formula is calculated incorrectly, it seems!
Should be:
(CTR_after – CTR_before) / CTR_before
Is currently:
(CRT_after – CTR_before) / CTR_after
Hi Alessandro
Thanks A LOT for pointing this. Just updated the post accordingly.
Cheers!