The complete guide to A/B testing with Google Play Store listing experiments
App Store Optimization (ASO)
March 20, 2019

Google experiments can be leveraged to optimize your Google Play Store listing.
It doesn’t matter what you’re A/B testing, successfully running Play Store experiments is done with the same process. And here what we describe the most is A/B testing a promo video for the Google Play Store.
There are two main goals to adding a promo video to your Play Store listing.
The first one is to increase conversion on the product page: get more installs for the same amount of store listing visitors. A video done the right way that shows what the app/game is all about and how it can bring value to the user should help convince the potential user to download the app.
The second is to increase engagement and retention after the install. A new user that has watched the video before downloading the video has a better idea of the value the app/game can bring him and is more likely to find his way around or keep playing.
- What kind of impact can you expect on conversion rate?
- Introducing Google experiments
- Before going further
- Step 1: Upload your promo video to YouTube
- Step 2: Create the Google Play Store listing experiment
- Step 3: Don’t look!
- Step 4: Analyze the results
- Step 5 (optional): Pre-post analysis of conversion rate
- Step 6 (optional): Perform a B/A test (counter-testing)
- Step 7 (optional): Tweak/optimize your promo video
- Measuring the impact on retention
- Conclusion
You’re having a video produced right now or we just delivered it?
You might be wondering how to assess the impact of your promo video on the Play Store. How can you know if the video helps?
Here is a step by step guide on how we advise to measure the impact.
Note: A LOT of the advice in this post is general and can be applied to experiments with other listing’s attributes (icon, screenshots, feature graphic, etc.) or even to other A/B tests. But this post has a specific focus on Google experiments with the video attribute.
What kind of impact can you expect on conversion rate?
We’ve had several clients that saw their conversion rate increase when adding a new promotional video for your Android app.
Sometimes they already had a video on the Play Store, and sometimes they were not using video yet.
The same results cannot be guaranteed. But measuring this is also the first step to optimizing your video in case it did not perform as well as expected (Step 7).
Introducing Google Play Store listing experiments
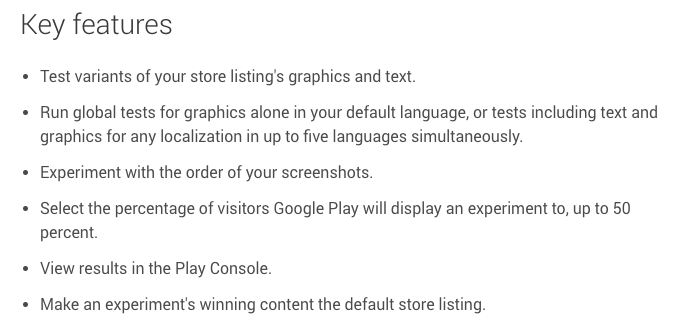
Google offers a tool in the Google Play Developer console called Store listing experiments.
With Google experiments you can A/B test changes to your store listing: a subgroup of the Play Store visitors will see version A, another subgroup will see version B.
You then compare which versions got more installs.
Before going further
Which localization(s) should you start on?
It’s great to be able to localize video on the Play Store.
If you have a significant user base that speaks another language, you can tailor the video to them.
With store listing experiments, you can run tests for any localization in up to five languages simultaneously.
That said, unless you have a great volume of downloads you should start A/B testing with only one language (example: EN-US).
Determining your objective
In the case where you do not already have a video on your Play Store listing, what you want to A/B test first is:
- Version A (Current Version): no promo video
- Version B (Variant with video): exact same listing but with a promo video
If you already have a video on your listing, what you want to A/B test first is:
- Version A (Current Version): current promo video
- Version B (Variant with video): new promo video
After running the experiment your objective is to determine whether video helped convert more visits to installs on the Google Play Store, and by how much.
So before getting started you want to define:
- The variable: the single element that gets changed (video vs. no video, new video vs. current video)
- The result: the expected outcome (by how much you believe it should change the conversion rate)
- The rationale: why you think it should change the conversion rate
Try to keep marketing/acquisition efforts relatively consistent
What the listing experiment measures is what’s happening in the Play Store only. But a lot of external factors can affect the results.
The main one we’ve identified (as long as your Play Store listing stays the same) are a big marketing or advertising push. If you have significant changes in advertising/marketing campaigns, then you run the risks of getting different behaviors from visitors on your Play Store listing: they might have already made their decision on downloading the app when getting there.
Because Google doesn’t differentiate by types of installs (Organic Search, Organic Browse, Third Party referrers like ad networks. etc.) this would therefore change the “usual source mix” of visitors which may have an impact on the changes/experiments you make (including video). Especially if they’ve already seen a video ad and are very clear on the added value of the app!
We understand keeping marketing/advertising the same might not always be possible, but at least keep this in mind.
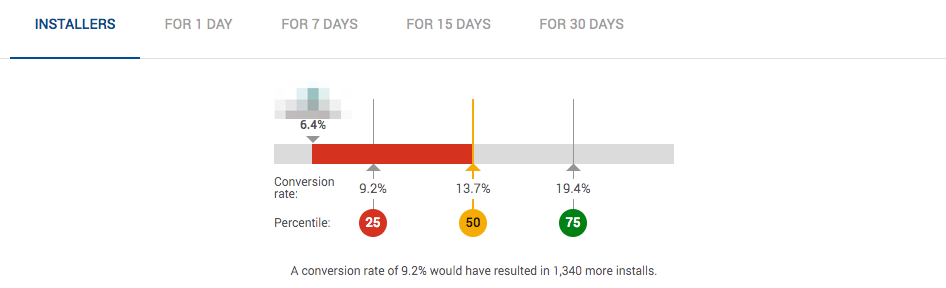
What is your current conversion rate?
For your app you can find these conversion rates in your Acquisition reports of your Google Play Developer Console.
Here is how they look:
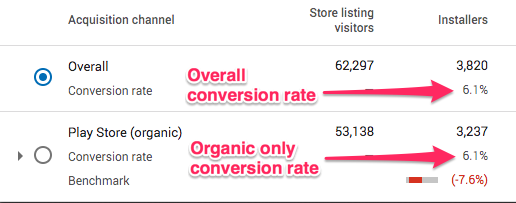
Take a note of each conversion rate for the previous week. You can also take note of the overall and organic conversion rates for the country where you plan on doing the test (in our case, United States since we’re choosing EN-US as language).
You are going to run an A/B test but you still want to know what these conversion rates are before, during and after the test (see Step 5 as well).
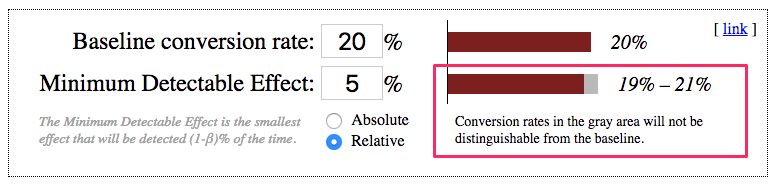
What volume of downloads do you need (and sample size)?
For your experiment you need to have a sample size that is big enough for Google to determine statistical significance (a “winner”).
Most people say you need thousands of installs for each version in order to get reliable results.
To help you out in determining your sample size, check out this handy Sample Size Calculator. Here is an example of parameters you may use:
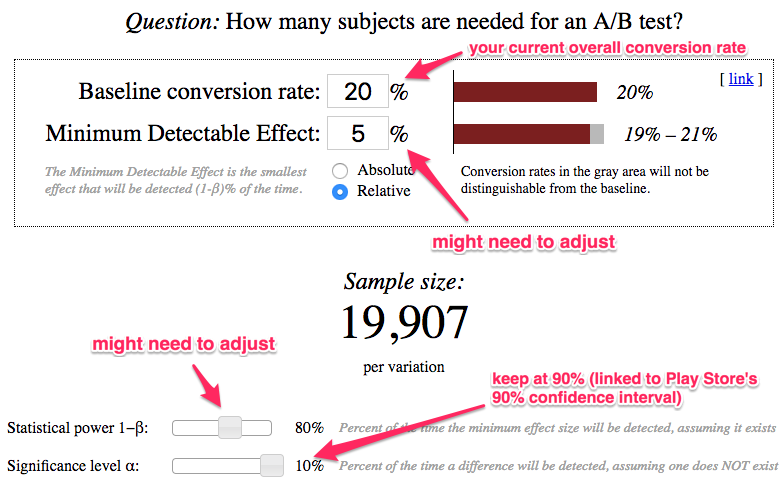
Important: the parameters indicated as “might need to adjust” might need to be different in your case (see explanation below).
Some of the parameters you need to define your sample size are fixed (significance level: 10%) or pretty straightforward (your conversion rate).
Others, however, will depend on how much you need to be careful about making changes:
- Minimum Detectable Effect (MDE)
- Statistical power
If you just launched or if you’re a startup with a few downloads and you’re willing to take more risks, you can have less stringent parameters for MDE and statistical power. What we have in the picture above are however pretty “usual” values (MDE: 5%, statistical power: 80%).
If you have a successful app that has been in the store for a long time and has great rankings, run a more delicate test with more stringent parameters. You can for example decrease MDE and increase the statistical power. Your sample size needed will increase but your results will be more precise.
In the example above, you need at least 19,907 visitors for each variant, so 39814 total. If you currently have a conversion rate of 20% like above then that would mean 7962.8 downloads total (or 3981 per variant – with only 2 variants as discussed here).
Running an experiment without waiting for this volume of downloads would make the test results unlikely to be accurate. So now let’s see how much time you need to run your experiment.
How long should you run your store listing experiment?
Of course this answer is tied to the volume of installs you have defined above.
As seen, we need a volume of 4,000 installs (rounding up the 3981 above) per variant. Let’s say that you have 5,000 installs per week, you’d have:
- 1 week test: 2,500 installs for each version. This is not enough.
- 2 weeks test: 5,000 installs for each version. This should give more reliable results.
So if you get 30k downloads per week should you just run an experiment for 2 days?

The answer is no. Play Store visitors’ behavior can vary over the course of the week or on the weekend, so we advise to at least make your experiment last a full week.
Once you’ve set your sample size and therefore how long your experiment should last, stick to it (see Step 3).
Why you should NOT test more than 2 versions at the same time
Play Store listing experiments allow you to do more T than just A/B tests: it allows to split test up to 4 versions (current version + 3 variants) at the same time.
We advise (and we’re not the only ones) to keep your testing to only 2 versions (current version + 1 variant). It’s not only about getting (more stable) results faster. It will also make it easier to analyse.
As Luca Giacomel from Bending Spoons explains “the real reason for not doing multiple A/B tests in parallel is that all of them will yield a lower statistical confidence due to a very famous statistical problem called the problem of “multiple comparisons” or “look elsewhere effect“.
So…Trust us. Don’t overcomplicate things.
Step 1: Upload your promo video to YouTube
A Google Play Store video is a YouTube video.
So to be able to add a promo video to your Play Store listing, you first need to upload it on YouTube.
As you know, there are 3 options on YouTube: public, unlisted and private. You can not use private for obvious reasons, so let’s take a look at the other two.
The advantage of an unlisted video is that you know that the most part of the views (often > 90%) are from people that saw the promo video on the Google Play Store. This makes your YouTube analytics much more meaningful and allow you to get insights on Google Play Store visitors’ behavior/engagement with your video(s).
If the video is public, then you can see the traffic sources. But you won’t be able to analyze the important video metrics by source (more on that in the last part of this post).
The advantage of a public YouTube video is that if your app listing gets a lot of traffic your video can quickly gather thousands of views that then make it rank better for search on YouTube (the second search engine after Google). Or even on Google.
In most cases we advise to start with your video(s) unlisted, at least until you’re confident it’s there for a while (i.e you are not optimizing/testing the video part for a while).
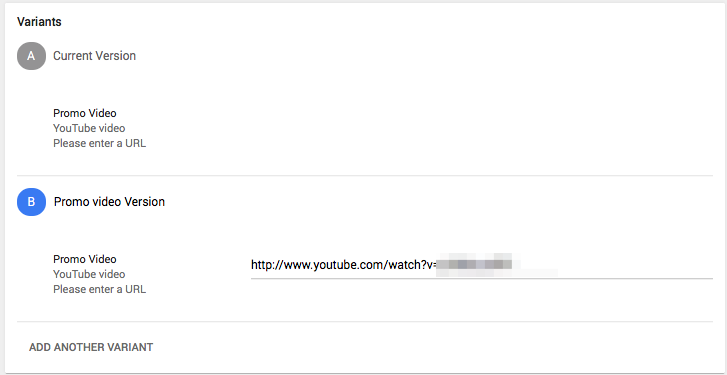
Step 2: Create the experiment
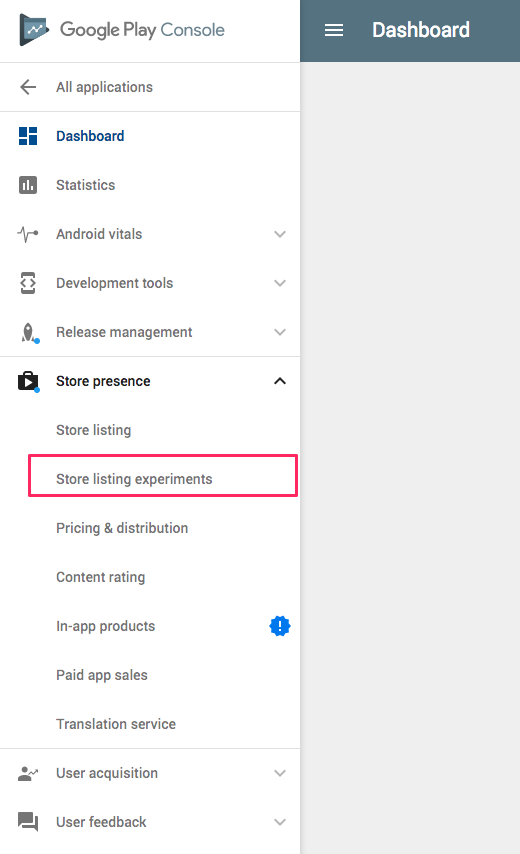
Open your Google Play Developer Console and go to the “store listing experiments” section in the “Store presence” section.
Click “New Experiment” then, select the desired language in the “Localized” section.
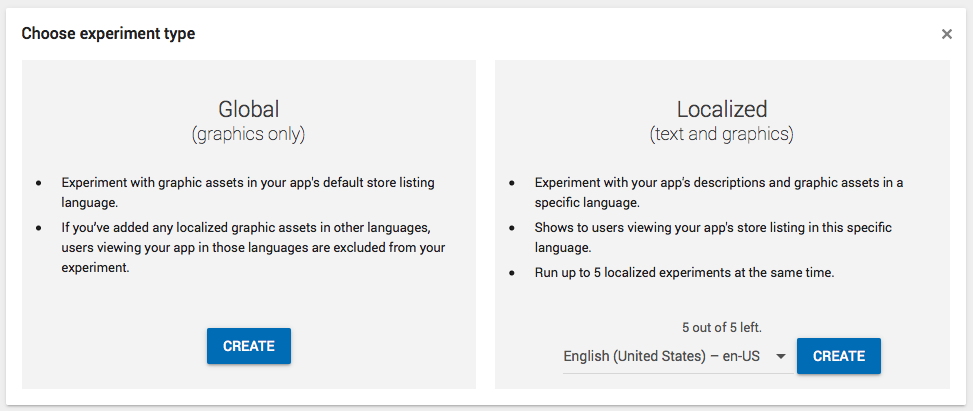
The reason to select “Localized” is that you want to test only on users that speak the language in which your video is, so the behavior of the others don’t affect the experiment.
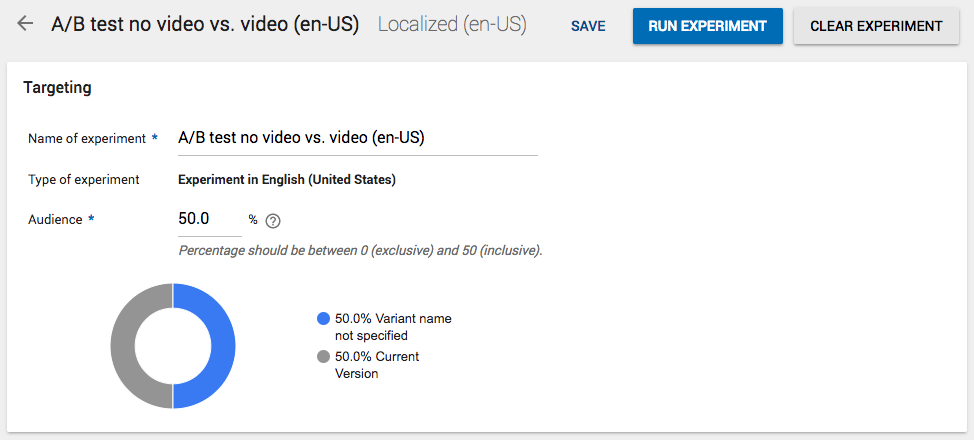
Create the experiment by giving it a name and choosing on how much of your audience will see the experiment. Choose the maximum allowed of 50%.
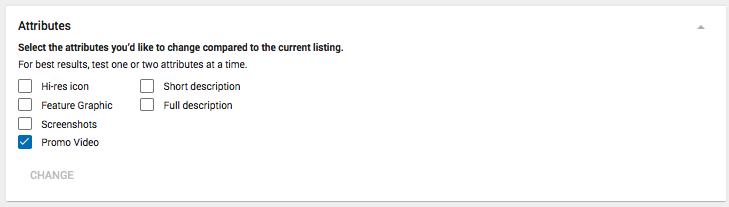
You then select what you’d like to change compared to your current listing. In this case, select only “Promo video”.
Name your Variant (example: Video) and paste the link of the YouTube URL for your video.
That’s it!
You can now run the experiment (keep reading though).
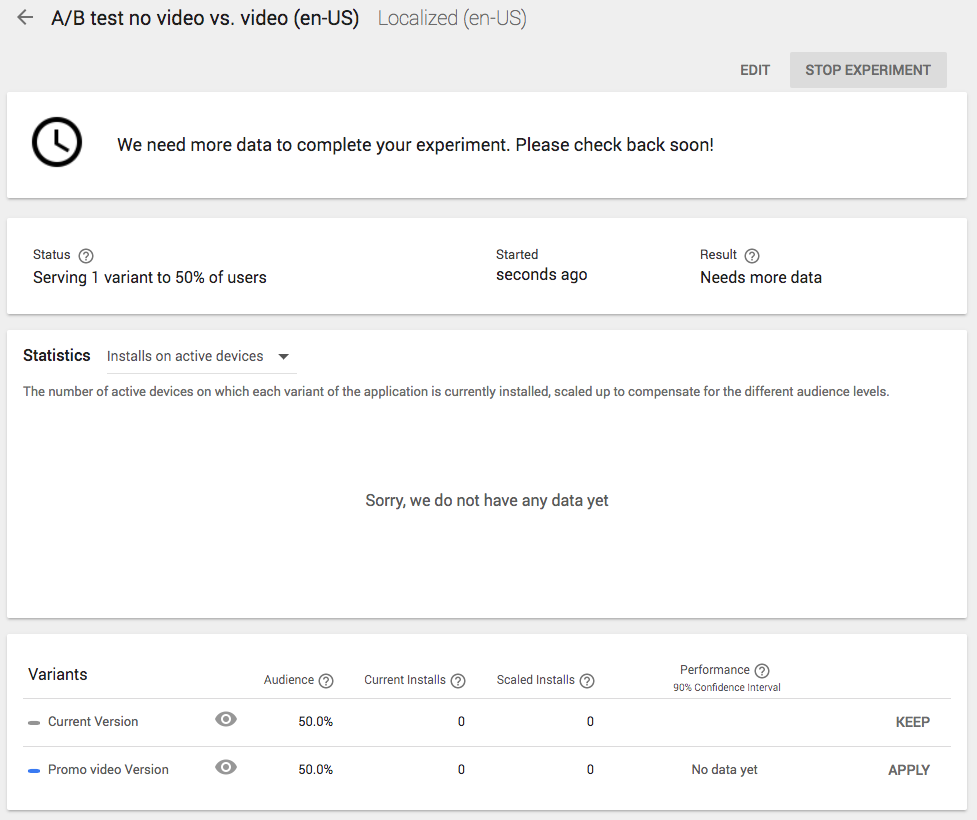
Step 3: Don’t look!
This is the hardest part.
Your experiment is running and it is very tempting to go back each day to get a sense of which variant is performing better.
Looking at the data will not change the results per say, but how much do you really trust yourself in case the experiment is not performing as well as you hoped (or worse)? Will you be able to keep it going?
It’s best to stick to your planned test period, and stay away from that damn experiment. Even if Google tells you the experiment is complete.
Why?
In super short: because of false positives. You might think (and Google might tell you) that the experiment is successful but since you haven’t reached the sample size defined it might actually not be the case.
The full stuff: if you really care to understand why, check out this post and read on significance levels and false positives.
Step 4: Analyze the results
OK so the test period is over and the sample size has been reached. Now is the time to see if the variant performed better.
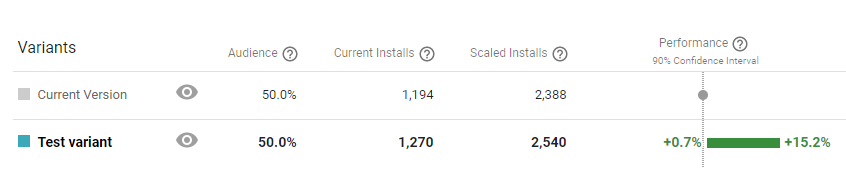
Current Installs is the number of actual installs for each version. Scaled Installs is what you would have gotten if only 1 version was running. Here it is twice as much because we are working with a 50-50 split.
If Google shows a winner
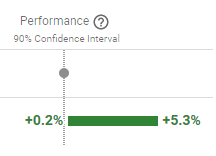
Performance for the variant is not fully positive
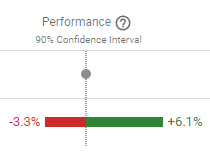
If you were to re-run the experiment 10000 times, then 90% of the times you would get a result that will be in this -3.3%-6.1% range
→ DO NOT APPLY the change
Performance for the variant is fully positive (>0)
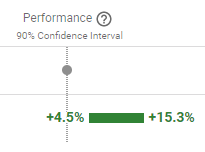
If you were to re-run the experiment 10000 times, then 90% of the times you would get a result that will be in this +4.5%-15.3% range
It also means that the other 10% of the times you could get a result that might not be in this range.
→ DO APPLY the change
Note: Remember the Minimum Detectable Effect (MDE) parameter you chose at the beginning?
Since it affects how big the “gray area” is, if the MDE is big then be careful with applying a change that gave you a result range too close to 0 (even if positive).
You can be less confident in the results if you get this kind of range,
especially if your MDE is 5% or bigger.
If Google says it needs more data
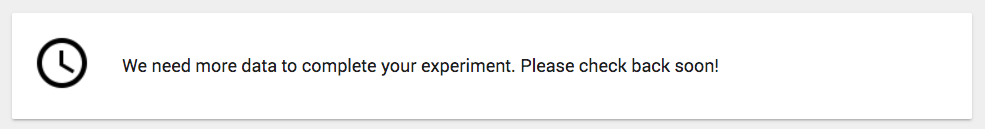
Again, be very careful: often Google will say there’s enough data after 2-3 days then revert back to “need more data”, hence why defining the sample size before the test is important (as well as following Step 3!) .
If Google says that the experiment is not over because it needs more data after the sample size has been reached, consider the experiment inconclusive so far.
→ DO NOT APPLY the change
Note: If the sample size has not yet been reached and Google says it needs more data, then it most likely means you haven’t read Step 3. So wait for the sample size to be reached and keep the experiment running.
Step 5 (optional): Pre-post analysis of your conversion rate
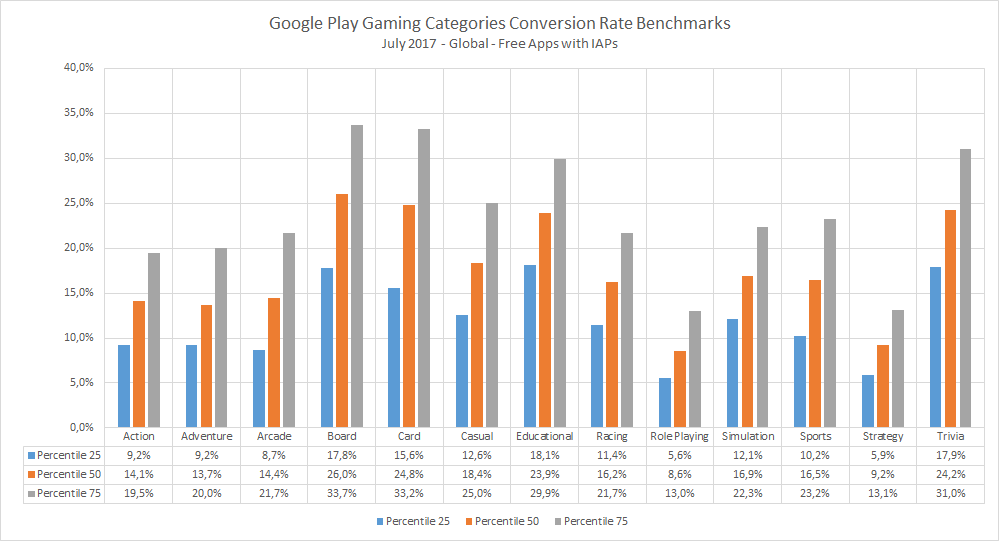
We talked at the beginning about the conversion rate benchmark that Google gives you, so you know where you stand and how much you could improve compare to other apps in the same category.
To further validate the results of your A/B test and see what actually happens once the change is implemented, look at the conversion rate percentage during the week period before the test and compare it to the conversion rate during the week after the test period.
To do this, it means you have to hold out on running another experiment during that time.
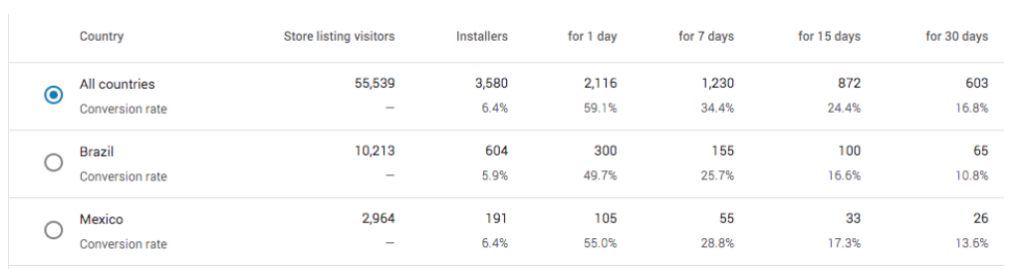
The conversion rate in the conversion benchmark is only for Play Store (Organic) visitors and includes all localizations/countries.
If you chose to do a localized experiment like we suggested, then instead look at the conversion rate for the corresponding country/language.
Needless to say, what you want to see is (all countries and for the targeted country/language):
Overall conversion rate before experiment > Overall conversion rate after experiment
Organic conversion rate before experiment > Organic conversion rate after experiment
If you’re not observing this, check the parameters/sample size you used and the results of the A/B test. Either run the same test again, or consider performing a B/A test.
Step 6 (optional): Perform a B/A test (counter-testing)
As we’ve seen above, you should only apply the change if the uplift is significant.
Thomas Petit (Mobile growth at 8fit) warns that the B/A test method described below is not valid from a pure statistical perspective, but could help discard the biggest mistakes. So he still recommends it. Check out his presentation and slides on A/B testing your store listing.
For a B/A test you would invert the versions:
- Version A (Current version): promo video on the listing
- Version B (Variant with no video): exact same listing but no video
Run the experiment the exact same way. If the same kind of performance is obtained, this will increase your confidence in the results.
Step 7 (optional): Tweak/optimize your promo video
There might be room for improvement for your video. Of course this is especially true if the results of the test were not positive.
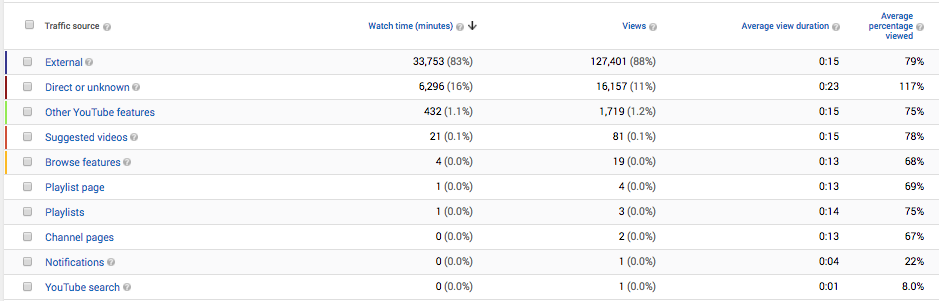
Analyze YouTube Analytics
Although you cannot know (yet?) who watched the video amongst visitors that installed the app, taking a look at the main metrics in YouTube Analytics can help you get a sense of how engaging your video is.
Here is what you want to look at:
- Number of views
- Average view duration
- Average percentage viewed
An interesting chart to look at is the “Audience Retention” chart: it lets you identify how quickly you are “losing” watchers.

If you see any sudden drops, try and think about how you could tweak the video to counter this.
Note: you can do the same thing with the YouTube videos you are using in your UAC campaigns.
Things you can try
What kind of tweaks can you try to optimize the video?
First, make a summary of your video structure. Something like:
- 2s animated phone with logo, icon and tagline
- 5s about value proposition 1
- 5s about value proposition 2
- 3/4s CTA
In the example above, one of the first things you could try is to completely remove the logo at the beginning: your branding is already on the Play Store listing (icon, app name, etc.).
You can also try to lead with a different value proposition. And of course, you can decide to go with a completely different concept.
A couple of tips and best practices:
- Optimized for small screen – your video will be played on a mobile device, so it should look good and be understandable even when small. Think zoomed-in device, etc.
- Put the most important benefit/value proposition first – there is absolutely no reason to lead with anything else. Your video does not have to start the same way the user journey starts.
- Make it understandable with no sound – a lot of visitors will not have the sound turned on, so use copy/texts. It is a YouTube video but they are on the Play Store, so not the typical YouTube user behavior (sound on).
- If you use video for several languages, make sure it is localized
Measuring the impact on retention
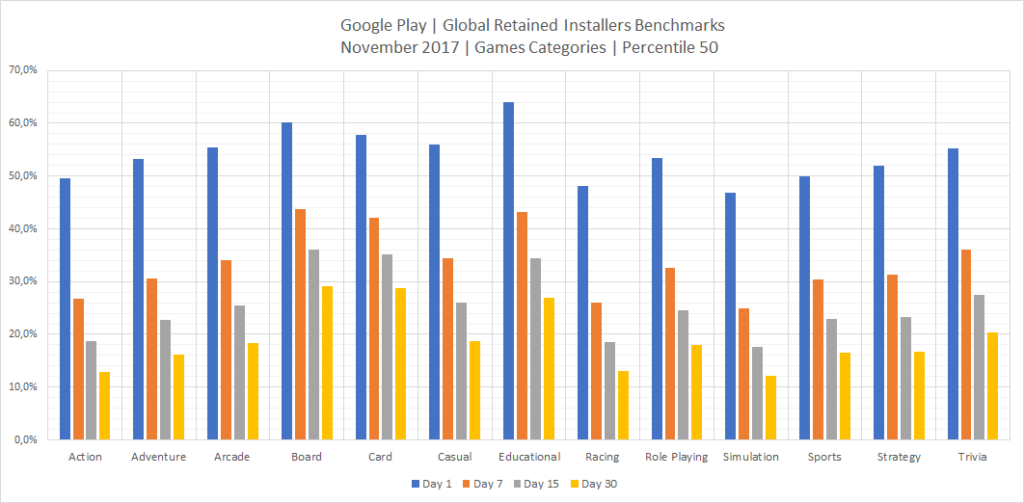
For the second goal mentioned at the beginning of this article (increasing retention), measuring is quite tricky. The only option so far seems to be a pre-post analysis (before vs. after).
Since Google added retention information (Day 1, Day 7, Day 15, Day 30 – cf. charts above), you can follow this metric precisely.
However you can not A/B test on cohorts over time and keep track of two groups of users: the ones for which the video showed up in the Play Store listing and the ones for which there was no video. This therefore makes it a real challenge to measure.
Conclusion
You want your video to help increase your conversion rate (get more installs) and/or your retention rates (keep users longer).
Play Store experiments can help you analyze the former, and you should take advantage of it (not only for video!). When running a store experiment:
- If doing a localized test, choose a single localization
- Define a single element you’re changing (video vs. no video, new video vs. current video), the expected outcome (% of improvement you’re expecting) and why
- Keep marketing/advertising efforts as steady as possible
- Define in advance your sample size and for how long you’ll run the test
- Do not stop the experiment before the sample size has been reached (we recommend to not even look, even if Google says it’s over)
- Analyze the results and apply the change if you have a winner
In the case where you are hesitant on doing an a/b test “live” on the Google Play store, you can also look into using a 3rd party a/b testing tool like Splitmetrics.
Have you run any experiments on the Google Play Store yet? Share your insights and lessons learned in the comments!
Follow Apptamin on Twitter
Follow me on Twitter
